Network visualization has become a strong need for studying the molecular interactions whether they are the protein or gene interactions. Network information is utilized in many contexts, from cellular functions to the identification of gene functions. Thus, an ever-increasing volume of the research has used network visualization to gain deep insight into the molecular interactions that influence our body functions.
Since the days of Flash have gone by, alternative technologies are rising. The interactive presentation used to be a dominion of Flash, It is no more same.
It is easier for the researchers to study the molecular interactions in-silico, so it is equally important to visualize the network (linkage among the molecules) over modern portable devices. Many web platforms have been developed using standard technologies such as HTML, CSS, JavaScript (JS) to do this.
Cytoscape.js leads the game.
Cytoscape.js is an API (Application Program Interface, i.e., it specifies how software components should interact and used to program graphical user interface), which allows the user to assimilate graphs into interaction models and web user interfaces.
Cytoscape.js is a stand-alone tool and its architecture is broadly classified into two categories:
1. Core: The core is the main entry point for the developer. Core functions allow accessing graph elements. It represents the graph, and perform various operations on the graph.
2. Collection: It is a set of graph elements. It allows to filter, traverse, perform various operations. Sometimes, it is taken as an input by some core functions.
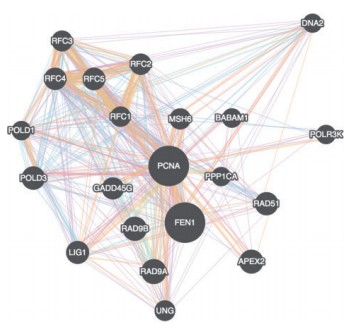
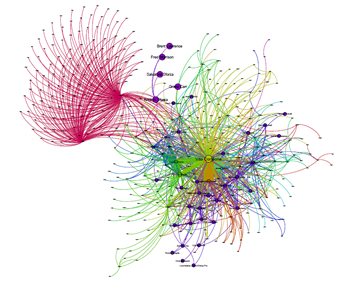
Fig.1 A gene-gene interaction network visualized in Cytoscape.js
Cytoscape.js offers a different type of graphs such as directed, undirected, traditional, multigraphs and hypergraphs. The graphs can also be modified by adding or deleting the graph elements such as edges. It includes the Graph theory algorithm which enables the user to search for the shortest path in the interaction graph. The graph consists of nodes representing the unit i.e., a protein or a gene. These nodes can also be modified by removing or by selecting the interested nodes only. The graph can be saved either in PNG or JPG format.
Cytoscape.js is an open source software and is available at http://js.cytoscape.org. It is an improvisation over the Adobe Flash-based Cytoscape Web.
Cytoscape.js Demo
In this demo, you can drag individual nodes, zoom in and perform other routine activities.
References:
1.Max Franz, Christian T. Lopes, Gerardo Huck, Yue Dong, Onur Sumer and Gary D. Bader*. Cytoscape.js: a graph theory library for visualisation and analysis. Bioinformatics, 32(2), 2016, 309–311 doi:1093/bioinformatics/btv557
2. Lopes,C.T. et al. (2010) Cytoscape web: an interactive web-based network browser. Bioinformatics, 26, 2347–2348.
3. 4 Network Visualisation Tools. Fusion Table, Google Fusion Table August 20, 2014


Hi,
I was just wondering… Is the introductory image generated in cytoscape.js? It looks more like Gephi visualization to me.
Hi Karel,
It is actually a representative image, the actual output can be seen in the demo.
Thank you.