The ever-increasing progress of sequencing techniques has developed a massive amount of genomic data [1]. This has led to an exponential growth of genomic datasets which provide huge information to the scientists. For identifying patterns and investigating biological information, it is necessary to visualize the genomes, but it is quite difficult to develop such tools.
GenVisR is a Bioconductor R package which provides flexible, user-friendly suite of tools for easy visualization of genomic data. It allows to visualize and interpret genomic data for multiple species under study in three categories: Variants, Copy number alterations and data quality [2]. GenVisR is a compilation of various functions and tools developed for the easy visualization of genomic data.
1. Visualization of Variants
GenVisR provides many functions to analyze the small variants within a genome which is required to be studied during the investigation of the genetic basis of a disease. The available functions in GenVisR to visualize small variants are:
a. Lolliplot
It keeps a precise control over visualization options provided in GenVisR, for example, to visualize the protein domains, a user can opt for Ensemble annotation databases. It also enables the user to plot mutations (Fig.1).

Fig.1 Output from lollipop for selected TCGA breast cancer samples (Cancer Genome Atlas Network, 2012) shows two mutational hotspots in PIK3CA within the accessory and catalytic kinase domains [2].
b. Waterfall
It allows to track the variant recurrence across the multiple genes and illustrates all the mutations in variants and also further differentiates between the variant types. The results are displayed by arranging the samples in a hierarchical manner such that the most recent genes are ranked first and so on (Fig.2).
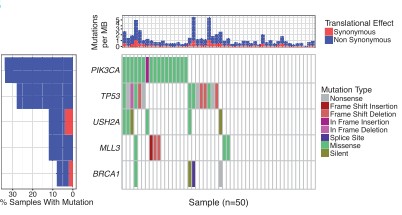
Fig.2 Output from waterfall showing mutations for five genes across 50 selected TCGA breast cancer samples with mutation type indicated by color in the grid and per sample/gene mutation rates indicated in the top and left sidebars [2].
c. TvTi
It is useful to find the rate of transition and transversion mutations occurred in a set of genes.
2. Visualization of alterations in Copy Number
Copy number alterations within the genome are identified in various diseases [3]. GenVisR provides various functions to easily visualize the copy number alterations.
a. GenCov
It displays the amplifications and deletions within the genomic region of interest (Fig.3).
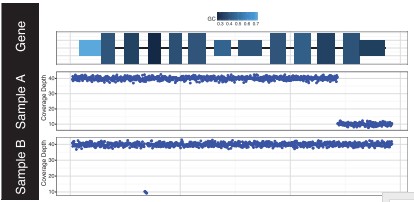
Fig.3 Output from GenCon displaying coverage (bottom plots) showing focal deletions in sample A (last exon) and B (second intron) within a gene of interest. GC content (top plot) is encoded via a range of colors for each exon [2].
b. cnView
It allows the user to plot copy numbers in a broader view and shows an ideogram for an individual sample at the chromosome level.
c. cnSpec
It displays copy numbers on a larger scale than cnView. It shows a heat map arranged in a grid indexed by chromosomes and samples.
c. cnFreq
It displays the frequency of samples within the genomic dataset which has gained or lost the copy numbers at specific gene loci.
d. lohSpec
Loss of Heterozygosity (loh) is important for studying genomic diseases. The function lohSpec displays all the LOH regions within the genomic dataset (Fig.4).
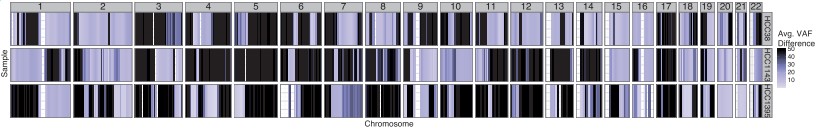
Fig.4 Output from lohSpec for HCC1395 (Griffith et al., 2015), HCC38 and HCC1143 (Daemen et al., 2013) breast cancer cell lines shows LOH events, across all chromosomes, shaded as dark blue.
3. Visualization of Data Quality
The quality assessment of sequencing data is of utmost importance for the proper interpretation of variants within the genome. GenVisR provides few functions for the quality assessment of the data.
a. covBars
It is a framework which displays the sequencing coverage for the targeted bases (Fig.5).
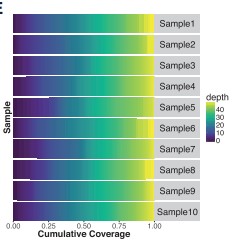
Fig.5 Output from covBars shows cumulative coverage for 10 samples indicating that for each sample, at least 75% of targeted regions were covered at 35 depth [2].
b. compIdent
It helps to identify the mixed samples that are thought to originate from the same genome (Fig.6).

Fig.6 Output from compIdent for the HCC1395 breast cancer cell line (tumor and normal) shows variant coverage (bottom plot) and SNP allele fraction (main plot) indicating highly related samples [2].
WORKING OF GenVisR:
Since GenVisR is an R package, therefore, it requires a simple R script to run a particular function and it accepts a default file format known as MAF (Mutation Annotation Format). It was first developed for The Cancer Genome Atlas project (Cancer Genome Atlas Research Network, 2008). For example, as illustrated by Z.L.Skidmore et al. (2016), to create Fig. 2 the following script was written in a standard MAF file containing variant mutation data and choosing which genes to plot [2] :
genes ¼ c(“PIK3CA”, “TP53”, “USH2”, “MLL3”, “BRCA1”)
GENVISR::WATERFALL(X ¼ MAF_FILE, PLOTGENES¼GENES)
References:
- Kodama,Y. et al. (2012) The Sequence Read Archive: explosive growth of sequencing data. Nucleic Acids Res., 40, D54–D56.
- Zachary L. Skidmore1 , Alex H. Wagner1 , Robert Lesurf1 , Katie M. Campbell1 , Jason Kunisaki1 , Obi L. Griffith1,2,3,4,* and Malachi Griffith. Bioinformatics, 2016, 1–3 doi: 10.1093/bioinformatics/btw325.
- Beroukhim,R. et al. (2010) The landscape of somatic copy-number alteration across human cancers. Nature, 463, 899–905.