The self-organizing map (SOM) sample hits plot in the Matlab [1] shows the number of inputs in the neurons but one would be interested in knowing what these input values are. In this article, we are going to get the input values from the neurons.
Let’s say we have a sample hits plot (Figure 1) and we want to know the input values of the 3rd neuron (highlighted with yellow). The numbering of neurons starts from bottom left to right. Here, the 3rd neuron shows 2 input values.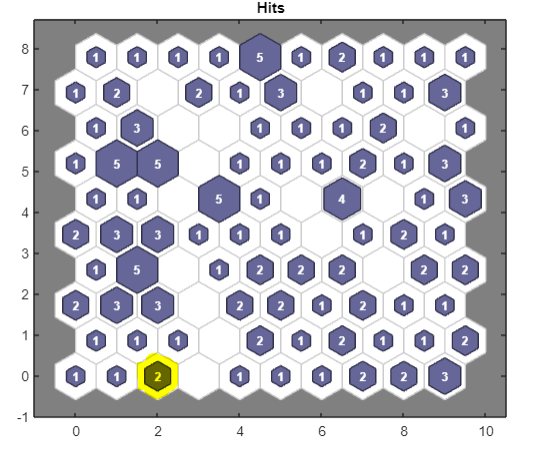
Figure 1 Sample hits plot from Matlab [1].
Now, after you train your data, you have to add one command to convert vectors to indices.
For example, the following code performs SOM analysis on your data.
>> x = data;
>> dimension1 = 10;
>> dimension2 = 10;
>> net = selforgmap([dimension1 dimension2]);
>> [net,tr] = train(net,x);
>> y = net(x);
% ---------Convert vector to indices----------------------
>> input_neuron_mapping = vec2ind(net(x))';
vec2ind function will convert vectors to indices. ‘input_neuron_mapping’ is a vector now.
Now, if you want to see the input values of neuron 3, then first see the inputs by which neuron 3 was classified.
>> neuron_3_input_indices = find(input_neuron_mapping == 3)
Now, see the original input values.
>> neuron_3_input_values = x(neuron_3_input_indices)
It will display 3 input values.
References
- MATLAB. (2022). version 9.12.0 (R2022a). Natick, Massachusetts: The MathWorks Inc.