Personalized medicines have become a very important part of the medicine world now a days. They are also known as ‘Individualized Medicines’. Personalized medicines allow a doctor to prescribe more specific and efficient medicines to a particular patient. This concept has created many more opportunities and aspects in the medicine world.
Personalized medicine concept is accomplished by obtaining high-throughput data sets from genomics, transcriptomics, proteomics and metabolomics, but more specifically it requires the ‘cross-omics’, i.e., linkage between transcriptomics, proteomics and metabolomics. Currently, there are simple web-based tools which do not allow much access to the high throughput datasets from the omics. But a new novel web based tool “Biominer” has been launched recently which provides access to a wide variety of high-throughput datasets. This tool was developed within the scope of an international and interdisciplinary project (SYSTHER).
Biominer provides the user various facilities with convenient tools which help them to analyze the high-throughput datasets and provides a deep insight for complex cross-omics datasets with enhanced visualization abilities.
Since Biominer was developed under Systher (System Biology Tools Development for Cell Therapy and Drug Development – www.systher.eu) project so its main focus is on cancer.
Public data repositories such as Gene Expression Omnibus (GEO) and ArrayExpress for microarray data, PRoteomics IDEntifications (PRIDE) for proteomics data, or Sequence Read Archive (SRA) of NCBI are used to store the biological high-throughput datasets for next- generation sequencing. The only limitation with these repositories is that they store biological data of a dedicated set of single omic type and do not support the cross-omics.
A database namely, SystherDB has been developed in which the stored data is well presented and easily accessible, and whose data is mined and analyzed by the BioMiner tools. A public instance of BioMiner is freely available online. It currently contains 18 different studies, with almost 4,000 microarrays and more than 187 Mio measured values of genes, proteins, or metabolites. Since BioMiner was developed in the SYSTHER project, most of the studies are focused on the glioblastoma multiforme (GBM).
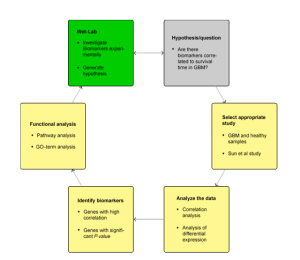
Fig.1 Workflow of BioMiner
FEATURES:
- BioMiner uses Google Web Toolkit (GWT) for the graphical user interface (GUI).
- A separate MySQL database is created which is manually curated and used to store the Experimental data from genomics, proteomics and metabolomics.
- Data import has to be performed by a dedicated specialist to ensure the data consistency.
- Response time is with in just a few seconds, for this purpose special indexing methods are implemented.
- Metabolite data are annotated using three different identifier systems: Golm Metabolome Database, Human Metabolome Database (HMDB), and Kyoto Encyclopedia of Genes and Genomes (KEGG).
- Predefined cross-omics relationship (e.g., a mapping of metabolites onto genes or vice versa) among the biological datasets.
- Pathway and functional information from Reactome, KEGG, and Wiki- Pathways.
- Gene Ontology is also supported.
- Correlation analyses (statistical analysis of any two variables) are based on Pearson correlation coefficients.
- Correlations are calculated for high-variance genes (by default top 500 genes).
- BioMiner complies with public data management standards such as Minimum Information About a Microarray Experiment (MIAME), Minimum Information About a Proteomics Experiment (MIAPE), and Minimum Information About a Metabolomics Experiment (MIAMET).
- ENSEMBL database is used for cross-mapping between the genes and proteins.
- Cross-mapping between the genes and metabolites the combined information of ConsensusPathDB and HMDB is used.
A
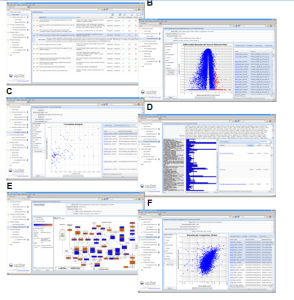
Fig2 . Data mining with Biominer. screenshots of different results from data mining with Biominer including the following: (a) study overview, (B) detection of differentially expressed genes, (C) correlation of gene expression and survival time, (d) identification of significantly enriched pathways, (e) visual pathway inspection based on predefined layouts, and (f) biomolecule comparison of gene and protein expression. results are typically presented in synchronized, parallel views composed of a table and a plot.
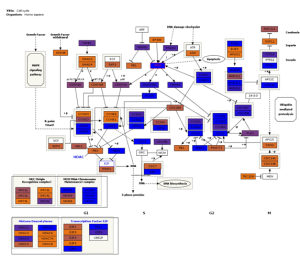
Fig3. Pathway visualization. Interactive pathway visualization of the cell cycle pathway from WikiPathways repository.
BioMiner is a web-based tool which provides various tools for studying the statistical analysis and a deep insight of transcriptomics, proteomics and metabolomics with cross-omics concept. Results are presented in two parallel views composed of a table and a plot. Both views are interactive and user-defined selections can be synchronized. Pathway visualization is achieved by extending the PathVisio library. It also provides clinicians and physicians a platform integrating high-throughput data together with clinical parameters, thereby leading to better personalized medicines.
References:
Chris Bauer1, Karol stec1, alexander Glintschert1, Kristina Gruden2, Christian schichor3, michal or-Guil4,5, Joachim selbig6 and Johannes schuchhardt1

![[Tutorial] Performing docking using DockingPie plugin in PyMOL.](https://bioinformaticsreview.com/wp-content/uploads/2023/10/dockingpie1.jpg)
