Diagnosis is a process to identify the exact cause of adverse symptoms experienced by the subject. In order to identify the cause, diagnosis process often looks at the constituents of the biofluid and check for the presence of a marker that is unique to the disease.
Biomarker is defined as cellular, biochemical or molecular alterations that are measurable in biological media such as human tissues, cells, or fluids.
Presence of various surface protein of the biopsy sample for cancer, bilirubin in urine for jaundice, blood glucose for diabetes is common examples of the biomarker. An ideal biomarker should have following properties a) should be sensitive and specific to a particular disease condition, b) present in a non-invasive and minimally invasive fluid, c) can be detected at a very early stage of a disease onset, d) rapid analysis and e) cost-effective. Therefore, although diagnostic markers for many diseases are already available, hunt for identification of a marker that matches best to the above-mentioned criterion is still on. In this article, I will confine my discussion on identification of biochemical marker using metabolomics.
Metabolomics is emerging as a latest revolution in the functional genomics arena. A total number of metabolites and their abundances/concentrations in a biological system is known as metabolome and was coined for the first time in 1998. The technological approach to capture the closest form of this metabolome information is known as metabolomics. Currently, Gas-Chromatography-Mass Spectrometry (GC-MS), Liquid Chromatography-Mass Spectrometry (LC-MS) and Nuclear Magnetic Resonance (NMR) are the major technology platform utilized for metabolomics analysis. However, none of the platform alone can identify all the metabolites present is a biological matrix viz, blood, serum, plasma, urine etc. It is estimated that there are close to 3000 metabolites present in human body, however, based on sensitivity, resolution, and type of instruments, a single platform can identify up to 1000 or little more.
In fact, the techniques used for capturing metabolome information are not new. All these analytical platforms are it mass spectrometric or magnetic resonance are known since 60’s or 70’s. However, with continuous development in terms of their sensitivity and resolution, numbers of molecules detected by these instruments have improved many folds. This was aided by concomitant advancement in the field of chemometrics. Chemometrics has made its presence relevant throughout the steps involved in metabolomics be its data acquisition, raw data pre-processing, pattern analyses and identification of important feature(s).
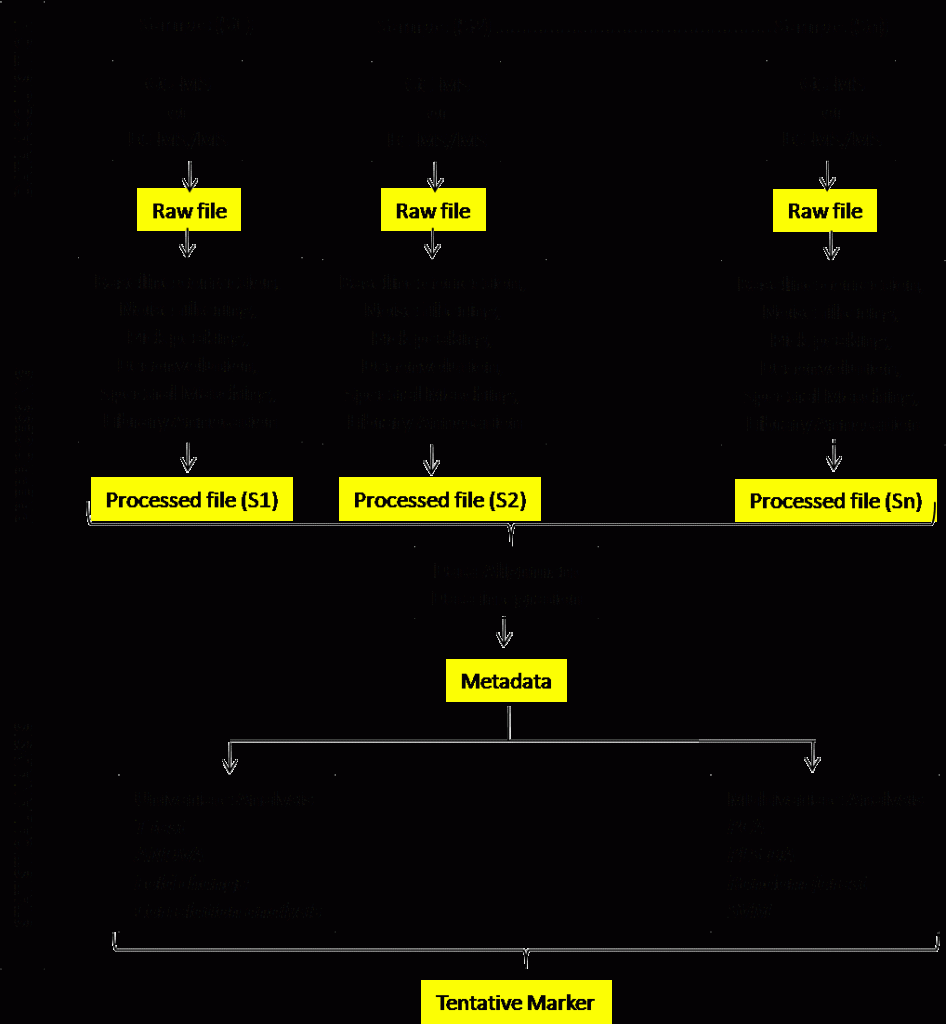
The real challenge is to identify the biomarker(s) of a particular disease from hundreds of metabolites identified by metabolomics. Here chemometrics plays an important role. Chemometrics can be defined as the method of analyzing chemical data using mathematical, statistical and informatics tools and techniques. For diagnostic marker discovery, case-control subject classification is used, i.e., a comparative analysis between well-characterized patients and healthy controls. In some cases, a set of a patient cohort is followed from diseased to clinically treated condition following therapeutic intervention for a comparative analysis between before disease and after disease condition. Figure 1 demonstrates the steps involved in metabolomics-based biomarker discovery.

Each sample following data acquisition in an appropriate platform generates a data file commonly called as a raw data file. The process of mining meaningful information from the raw data file for further analysis is called data pre-processing. In mass spectrometric platform (GC-MS, LC-MS) data pre-processing include following steps: baseline correction, noise filtering, pick peaking, deconvolution, spectral matching, library annotation, alignment, and data integration. Currently, most of the instrument manufacturer develop their own software for data pre-processing, albeit external software are also available for pre-processing of MS raw data.
Following data alignment and integration in raw data analysis the analyst now have the metadata or the data matrix to analyze further for pattern analyses and identification of important feature. It involved multiple statistical steps to identify a robust biomarker of a set of biomarkers. Considering the complexity of the data matrix and variations within or between the groups, metabolomics researchers use both uni- and multivariate statistical tools to identify biomarkers. In practice, they develop a statistical model using a set of samples known as discovery set to identify important features that have a difference in presence between or among groups viz., disease/non-disease, before/after disease, mild/moderate/severe disease. The validity of the model is then checked in different sets of a subject if these tentative biomarkers can place the subjects in the appropriate group.
In the upcoming articles on Chemometrics in Metabolomics, I will be discussing the raw data analyses part using bioinformatics tools and techniques and also about the statistical investigation for biomarker discovery.
Bibliography and Further Reading:
- Johnson, C.H., Ivanisevic, J., Benton, H.P., Siuzdak, G., 2015. Bioinformatics: The Next Frontier of Metabolomics. Analytical Chemistry 87 (1), 147-156.
- Wishart, D., 2009. Bioinformatics for Metabolomics. In: Krawetz, S., (Ed.,): Bioinformatics for Systems Biology, pp 581-599. DOI 10.1007/978-1-59745-440-7_30.
- Blekherman, G., Laubenbacher, R., Cortes, D.F., Mendes, P., Torti, F.M., Akman, S., Torti, S.V., Shulaev, V., 2011. Bioinformatics tools for cancer metabolomics. Metabolomics 7 (3) 329-343.


A very informative article with insights into practical approaches in this field. Eagerly waiting for the coming issues