Classification of biological species is one of the important concern while studying taxonomic and or evolutionary relationships among various species. Classification is either based on only one / a few characters known as “Monothetic”, or based on multiple characters known as “Polythetic”.
It is obviously much more difficult to classify organisms on the basis of multiple characters rather than a few characters. The traditional approaches of taxonomists are tedious. The arrival of computer techniques in the field of biology has made the task easier for the taxonomists.
Numerical taxonomy is a system of grouping of species by numerical methods based on their character states. It was first initiated by Peter H.A.Sneath et al.
Before going further I would like to clear the difference between two common terms, namely, “Classification” & “Identification”. When the organisms are classified on the basis of like properties, then it is called Classification, and after the classification, when the additional unidentified objects are allocated, then it is known as Identification. The purpose of taxonomy is to group the objects to be classified into natural taxa. Conventional taxonomists equate the taxonomic relationships with evolutionary relationships, but the numerical taxonomists defined them as three kinds:
- Phenetic: based on overall similarity.
- Cladistic: based on a common line of descents.
- Chronistic: temporal relation among various evolutionary branches.
How is the classification do by Numerical Taxonomy?
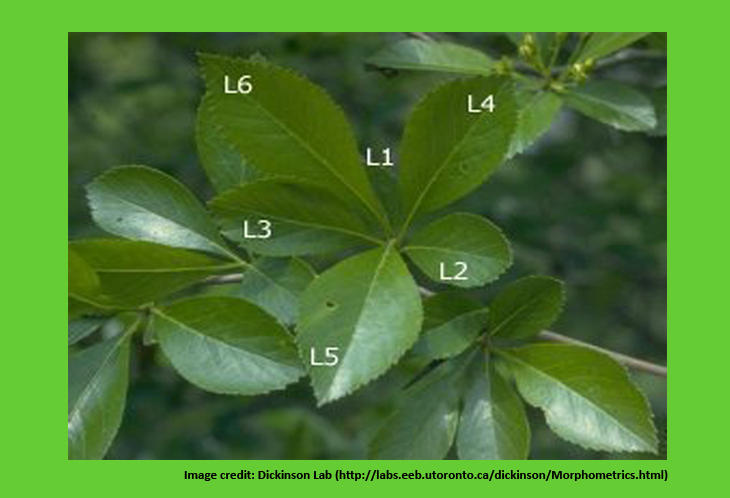
The objects to be classified are known as Operational Taxonomic Units (OTUs). They may be species, genera, family, higher ranking taxonomic groups,etc., The characters are numerically recorded either in the form of appropriate numbers or may be programmed in such a way that the differences among them are proportional to their dissimilarity. Lets say, a character called ‘hairness of leaf’, it may be recorded as:
- hairless = 0
- sparsely haired = 1
- regularly haired = 2
- densely haired = 3
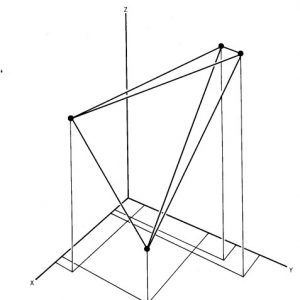
Fig.1 OTUs (black dots) represented in a multidimensional space.
Such a numerical system imply that the dissimilarity between densely haired and hairless is 3 times than that of sparsely haired and hairless.
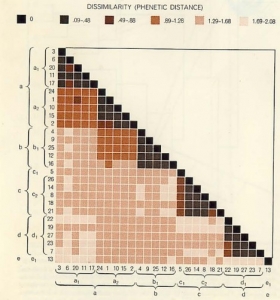
The other method of implementing numerical taxonomy is that the characters are always represented by only two states,i.e., 0 for the absence and 1 for the presence of a particular character. This method is usually implemented in the field of microbiology. After that, all the characters and the taxonomic units are arranged in the form of the data matrix and the similarity among all possible pairs of OTUs is computed based on the considered characters. The similarity ( more specifically, dissimilarity) is the distance between OTUs is represented in a multidimensional space, where the characters can be visualized as the coordinates. The objects that are very similar are plotted close to each other and those which are dissimilar are plotted farther apart. Then these straight lines are computed. The similarity among the OTUs is calculated by ‘simialrity matrix’ having few color schemes, where the dark-shaded areas are highly similar. This matrix is then rearranged to get the clusters of similar OTUs. The results of numerical taxonomy are generally represented in the form of phenograms.
Note:
An exhaustive list of references for this article is available with the author and is available on personal request, for more details write to muniba@bioinformaticsreview.com.

