
In continuation with the series under “Do you Hyphy…”, this article envisages another very important analytical tool that Datamonkey web server[1] provides us called EVOBLAST[1,2]. EVOBALST stands for Evolutionary Fingerprinting Analysis Results[3]. It is a remarkable tool which identifies a. whether a multiple sequence alignment datasets (in partitions or globally) is under different rates of evolution i.e. different dN/dS rates over different regions/partitions, signifying positive or negative selection (for details read previous articles on this series), b. and if they are found to be evolving differentially, then it also depicts in a graphical form which regions in the multiple sequence alignment are under positive, negative or neutral selection.
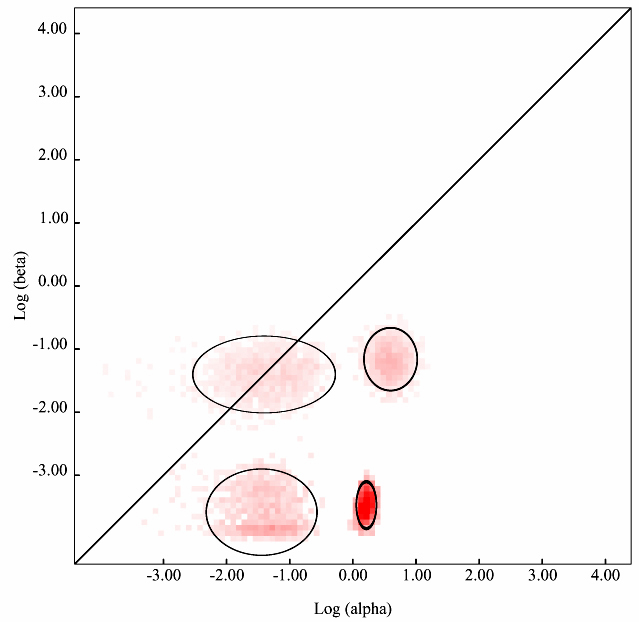
To run this module, gene coding sequence dataset is required to be uploaded on data analysis page. Select a suitable substitution model (one can use the Model Select module for this, also available on the Datamonkey web server) and select Evolutionary Fingerprinting option, based on 1000 distribution samples from the drop-down menu. Depending on the size of the query dataset, the remote computer cluster will take few minutes to several minutes and will return with Maximum Likelihood Estimates (MLE) as well as the graph (such as the one shown in Figure 1) depicting the estimate of the distribution of synonymous and non-synonymous rates inferred from the alignments. The pink pixels and the intensity of the pink shade (light pink to dark pink) for each pixel show the maximum likelihood estimate/probability of the selection pressure of a site/region undergoing negative, positive or neutral selection. The diagonal line shows the neutral evolution (mostly no change or non-synonymous changes). Thus regions falling on the diagonal line are under neutral evolution while the regions above the diagonal line are under non-synonymous or purifying or positive selection. Similarly, regions with pink pixels below the diagonal line are under negative selection. Although, the depiction and MLE are highly accurate and the graph output so obtained is of publication quality but still it is highly recommended that the finding of this module must be correlated with other similar data output based modules/application to strengthen the interpretation.
References
1. Delport, W., Poon, A.F., Frost, S.D.W., Kosakovsky Pond, S.L., 2010. Datamonkey 2010: a suite of phylogenetic analysis tools for evolutionary biology. Bioinformatics 26(19): 2455–2457
2. Kosakovsky Pond, S.L., Frost, S.D.W., 2005. Datamonkey: rapid detection of selective pressure on individual sites of codon alignments. Bioinformatics 21(10): 2531-2533
3. Kosakovsky Pond SL, et al., 2010. Evolutionary fingerprinting of genes. Molecular Biology and Evolution 27:520–536.