Roary is a pangenome genome pipeline, which calculates pangenome of a set of related prokaryotic isolates [1]. It takes annotated assemblies in the gff3 format generated by Prokka [2] and provides the pangenome. The working methodology has been explained in our previous article. In this article, we will learn how to create the pangenome of a few isolated genome sequences using Roary [1] and Prokka [2].
Input for Roary
- Genome sequences in the form of gff3 files.
Downloading the genome sequences
At first, you need to download genome sequences as per your need, which you can easily download yourself or by using the ncbi-genome-download package. It provides several scripts to download genome sequences from NCBI FTP servers. To install this package, open a terminal (Ctrl + T) and type the following commands:
$ pip install ncbi-genome-download
After downloading this package, you can download the genome assemblies as per your requirements such as fasta sequences of all bacteria, viral genome, RefSeq genome sequences in GenBank format, fungal genomes and so on. (Remember, while downloading gff3 files, you need to download Genbank files with the nucleotide sequence because gff3 files on the NCBI website contain annotation only). I will download all bacterial sequences in fasta format using the following command (showing this example with only a few sequences only):
$ ncbi-genome-download --format fasta bacteria
Annotating the genome sequences
Go into the directory of Roary, create a new folder, let’s name it as ‘example’, and save those downloaded sequences. After downloading, you will see many fasta files in the same folder. Now start annotating them to determine the attributes and location of the genes present in them, and also to obtain gff3 files which are used as an input in roary. This can be easily done with Prokka [2]. Open the terminal and type the following commands:
$ cd Downloads/Roary/example/
$ prokka --kingdom Bacteria --outdir prokka_GCA_000006285 --genus Salmonella --locustag GCA_000006285 GCA_000006285.2_ASM828v3_genomic.fna
You can further add other descriptions such as organism details (genus, species, etc.). Make sure you annotate all the genome sequences you are dealing with and remember to change the output directory name, locus tag, and assembly version accordingly. After running this command, a new directory will be created in the name of each sequence and will consist of 12 files with different extensions including the gff3 file.
Creating pangenome/Running Roary
We have got gff3 files of the genome sequences in the directories, now we need to copy the gff3 file from each directory into another directory (let’s say, gff_all). After that, open the terminal again and type the following command to run roary:
$ roary -f ./tutorial -e -n -v ./gff_all/*.gff
At this stage, Roary will get all the coding sequences, translate them into protein sequences, and generate pre-clusters. After that, roary will look for the paralogs using blastp [3] and create clusters using MCL [4]. Finally, it will take every isolate and order them according to the presence/absence of orthologs. This will take time depending upon the number of sequences (or gff3 files) you are using.
If you want to create a pangenome without the core alignment, then use the following command:
$ roary -f ./tutorial -v ./gff_all/*.gff
If you want to change the percentage identity of blastp (not advised to go below 90%), then use the following command:
$ roary -f ./tutorial -i 90 -v ./gff_all/*.gff
These commands will result in a new directory called tutorial (as given name in the command), where all result files will be found. You can see the summary statistics in the file named ‘summary_statistics.txt‘, it will look like this:
summary_statistics.txt
|
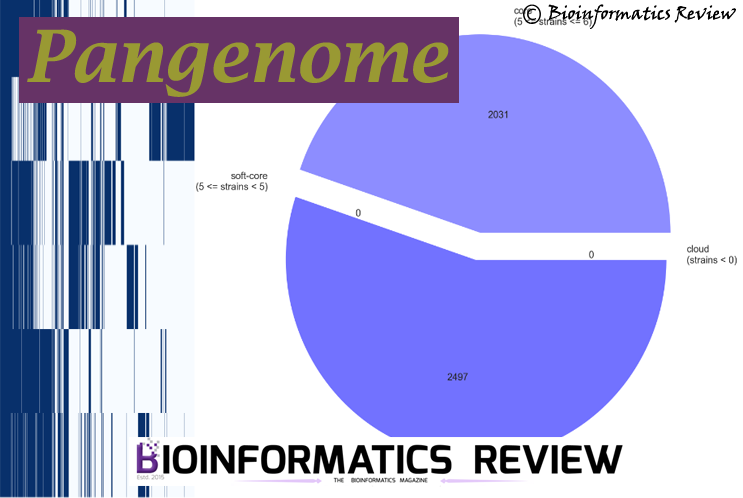
Core genes (99% <= strains <= 100%) 2031 Softcore genes (95% <= strains < 99%) 0 Shell genes (15% <= strains < 95%) 2497 Cloud genes (0% <= strains < 15%) 0 Total genes (0% <= strains <= 100%) 4528 |
Visualizing results
Similarly, you will find some other output files such as ‘gene_presence_absence.csv‘, ‘accessory_binary_genes.fa.newick‘. ‘roary_plots.py’ script (written by Marco Galardini) will be used to visualize the results, which is present inside the directory named contrib in the main roary directory. Open the terminal, go into the tutorial directory (where all the result files are present) and type the following:
$ cd tutorial
$ /home/user/Downloads/roary/contrib/roary_plots/roary_plots.py accessory_binary_genes.fa.newick gene_presence_absence.csv
You will see three png files that will be added in the same tutorial directory: pangenome_frequence.png (Fig. 1), pangenome_matrix.png (Fig. 2), and pangenome_pie.png (Fig. 3) as shown below.
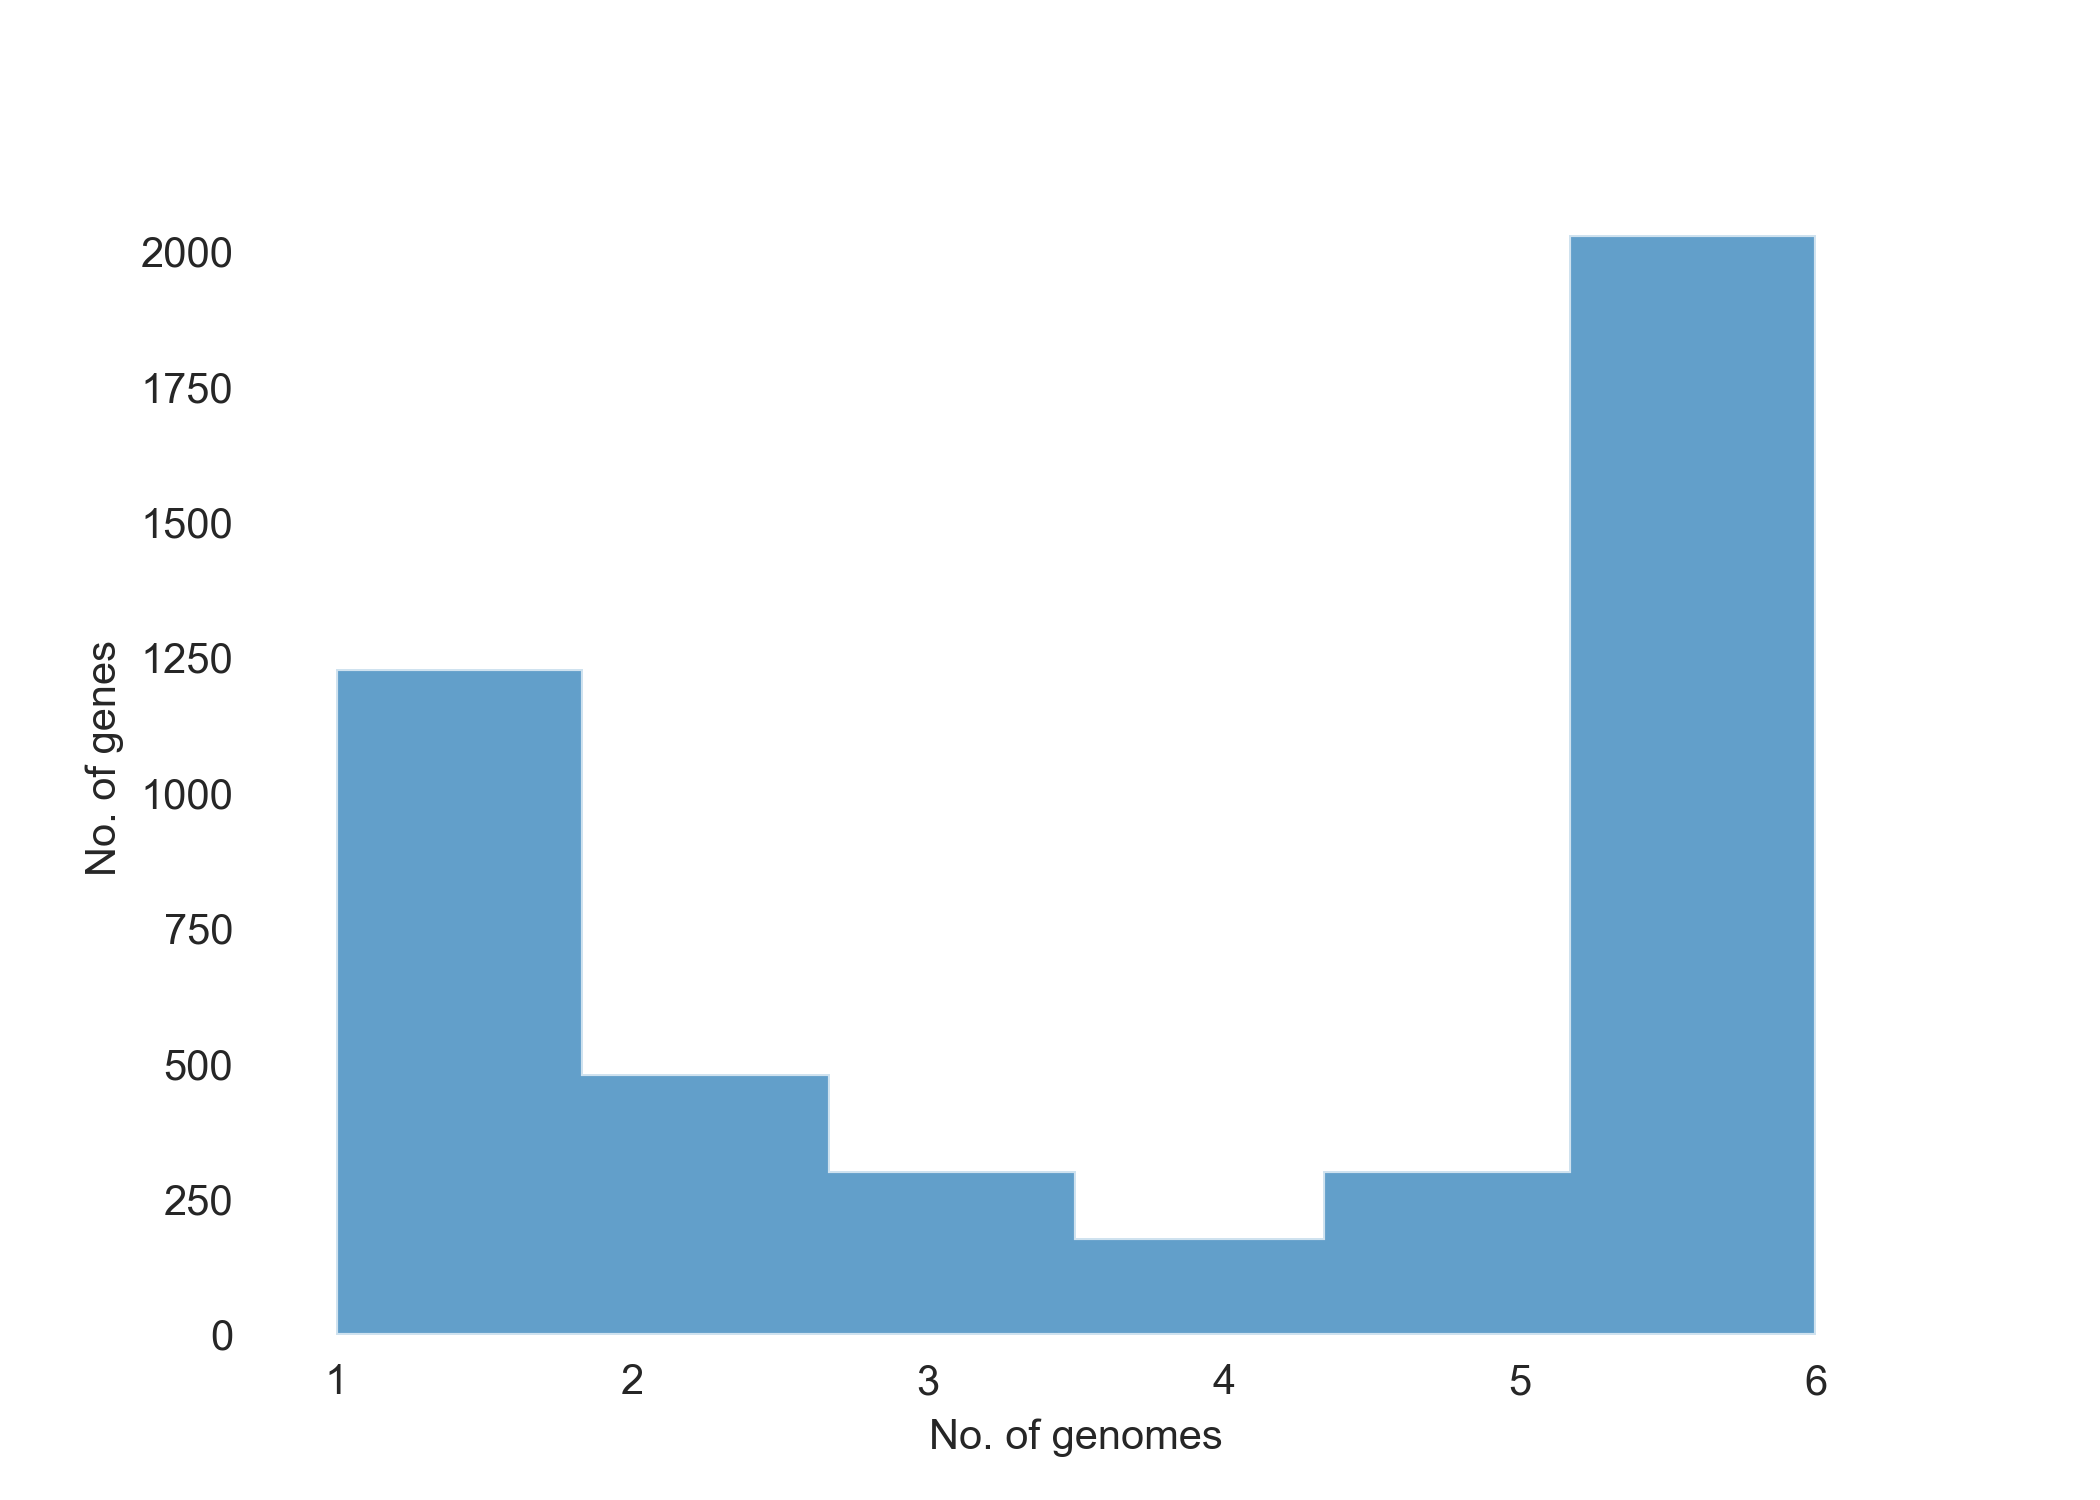
Fig. 1 showing the number of genes present in each genome sequence.
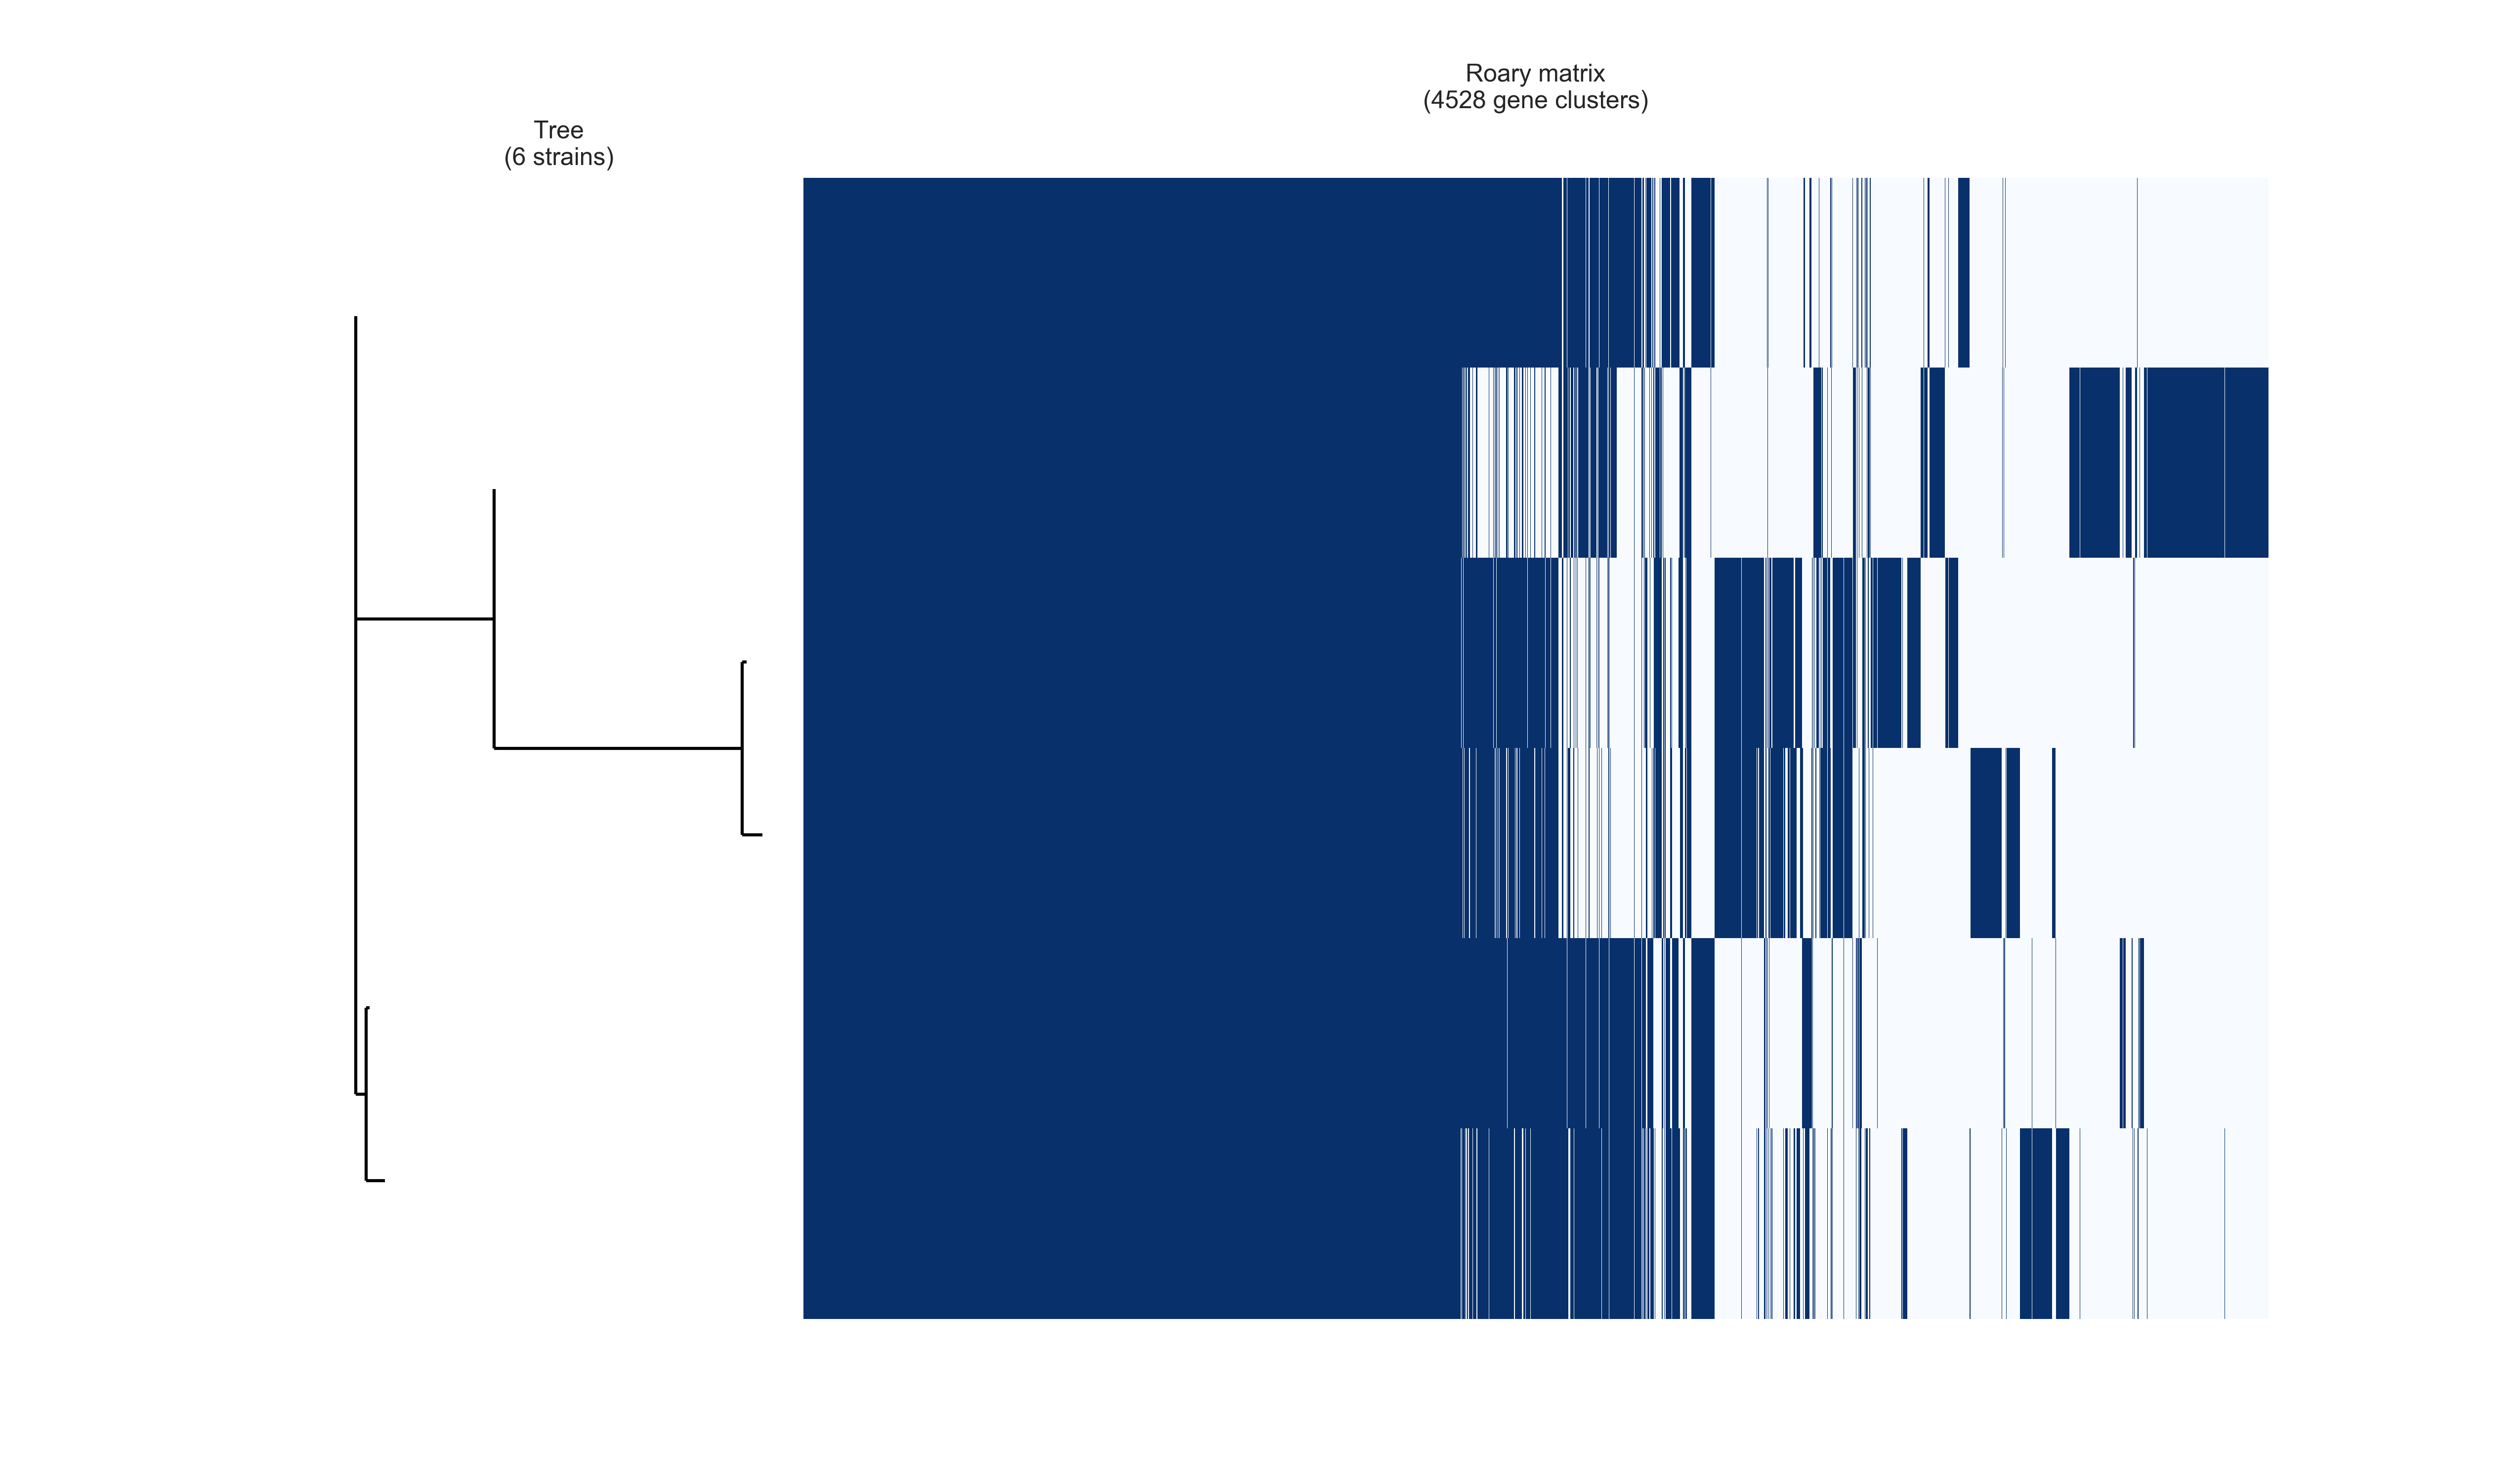
Fig. 2 Gene clusters.

Fig. 3 represents a pie chart showing different genes present in the genome sequences.
Additionally, you can also visualize the Newick file in phylogeny software such as Mega for further analysis.
This article demonstrated the creation of a pangenome of isolated genome sequences using roary. In case of any queries, please write to us at info@bioinformaticsreview.com or tariq@bioinformaticsreview.com.
References
- Page, A. J., Cummins, C. A., Hunt, M., Wong, V. K., Reuter, S., Holden, M. T., … & Parkhill, J. (2015). Roary: rapid large-scale prokaryote pan genome analysis. Bioinformatics, 31(22), 3691-3693.
- Seemann, T. (2014). Prokka: rapid prokaryotic genome annotation. Bioinformatics, 30(14), 2068-2069.
- Altschul, S.F., Gish, W., Miller, W., Myers, E.W. & Lipman, D.J. (1990) “Basic local alignment search tool.” J. Mol. Biol. 215:403-410.
- Dongen S van. Graph Clustering by Flow Simulation. University of Utrecht; 2000.


![[Tutorial] Performing docking using DockingPie plugin in PyMOL.](https://bioinformaticsreview.com/wp-content/uploads/2023/10/dockingpie1.jpg)