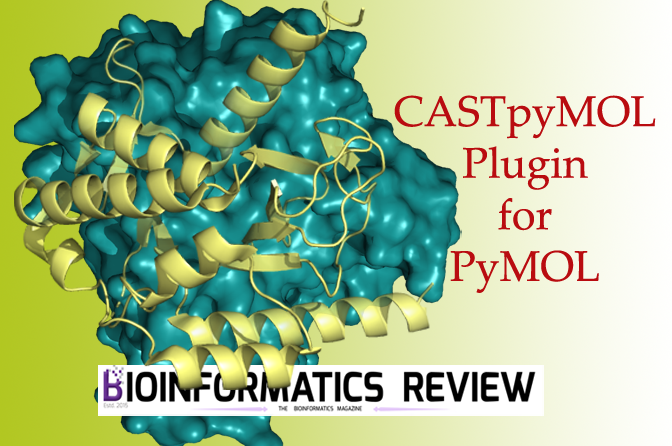
CASTp (Computed Atlas of Surface Topography of proteins) server is used to predict binding pockets and cavities in proteins [1]. It displays binding pockets precisely and predicts all possible binding pockets or cavities based on an algorithm.
The pockets can be viewed in different colors and styles. CASTp server allows users to download their results. However, it is more convenient to visualize these results. For that purpose, there is a plugin called CASTpyMOL v3.0 that can be installed easily and all the results generated by the CASTp server can be visualized in PyMOL.
Installing Plugin
- Download the plugin from here.
- Open PyMOL.
- Go to ‘Plugin’ –> ‘Plugin Manager’.
- Click ‘Install New Plugin’ –> ‘Choose File’. Select the downloaded plugin file.
- Restart PyMOL.
Now you can open CASTp result files in PyMOL to visualize all predicted binding pockets. Additionally, you can view through its PDB or job id from the CASTp server.
References
- Tian, W., Chen, C., Lei, X., Zhao, J., & Liang, J. (2018). CASTp 3.0: computed atlas of surface topography of proteins. Nucleic acids research, 46(W1), W363-W367.


