In this article. we are creating a pie chart of the docking score of five different compounds docked with the same protein.
In the following Python code, let’s store the docking scores in a variable called ‘data‘, and compound names in the ‘label‘ variable.
import matplotlib.pyplot as plt
import numpy as np
%matplotlib inline
data = [6.3, 7.8, 6.9, 7.0, 8.5]
label = ['cmp1', 'cmp2', 'cmp3', 'cmp4', 'cmp5']
plt.pie(data, labels=label, autopct='%.0f%%', explode=[0,0,0,0,0], shadow=False, startangle=90, wedgeprops = {"alpha": 0.3})
#plt.bar(data, label, 0.1, alpha=0.5)
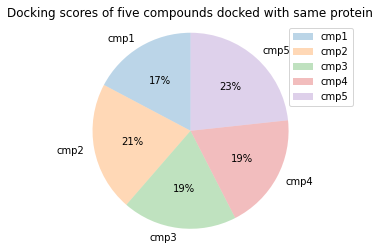
plt.title('Docking scores of five compounds docked with same protein')
plt.axis('equal')
plt.legend()
plt.show()
You can save this file in Python format or run it in Notebook. It will generate a pie chart as shown below: