Bioinformatics ReviewBioinformatics Review
Notification Show More
Font ResizerAa
  •  Home
  • Docking
  • MD Simulation
  • Tools
  • More Topics
    • Softwares
    • Sequence Analysis
    • Algorithms
    • Bioinformatics Programming
    • Bioinformatics Research Updates
    • Drug Discovery
    • Phylogenetics
    • Structural Bioinformatics
    • Editorials
    • Tips & Tricks
    • Bioinformatics News
    • Featured
    • Genomics
    • Bioinformatics Infographics
  • Community
    • BiR-Research Group
    • Community Q&A
    • Ask a question
    • Join Telegram Channel
    • Join Facebook Group
    • Join Reddit Group
    • Subscription Options
    • Become a Patron
    • Write for us
  • About Us
    • About BiR
    • BiR Scope
    • The Team
    • Guidelines for Research Collaboration
    • Feedback
    • Contact Us
    • Recent @ BiR
  • Subscription
  • Account
    • Visit Dashboard
    • Login
Font ResizerAa
Bioinformatics ReviewBioinformatics Review
Search
Have an existing account? Sign In
Follow US
MD Simulation

How to visualize output plots of MD simulation (GROMACS)?

Dr. Muniba Faiza
Last updated: May 9, 2023 9:31 am
Dr. Muniba Faiza
Share
1 Min Read
How to visualize output plots of MD simulation (GROMACS)?
SHARE

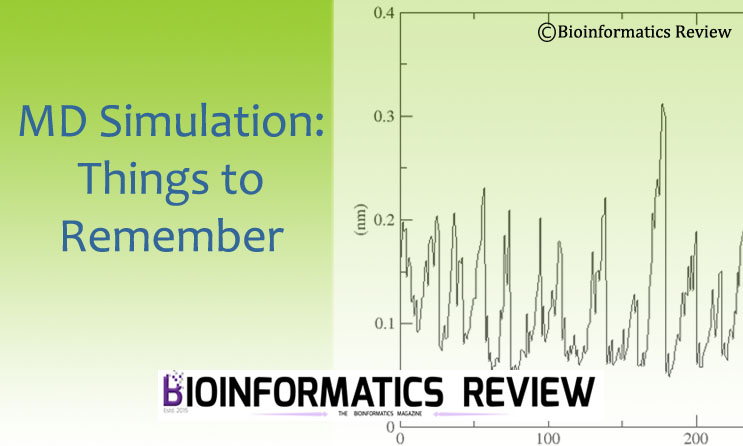
Visualizing plots of molecular dynamics simulation is easy once you have generated them. Previously, we provided a few articles on MD output analysis (check the Further Reading section). This article explains how you can easily visualize the plots generated from GROMACS output.

Contents
  • Installing Xmgrace on Ubuntu (Linux)
  • Visualizing plots in Ubuntu (Linux)
  • Installing Qtgrace on Windows
  • Visualizing plots in Windows
    • Further Reading

Once you have generated .xtc files for RMSD, RMSF, temperature, pressure, and so on, you can see them using the xmgrace program in Ubuntu (Linux) and the Qtgrace program in Windows.

Installing Xmgrace on Ubuntu (Linux)

Open a terminal (Ctrl+Alt+T) and paste the following command:

$ sudo apt-get install grace

Visualizing plots in Ubuntu (Linux)

We will use the xmgrace module to visualize xvg plots in Ubuntu.

$ xmgrace <plotname.xvg>

Write your plot name in place of <plotname.xvg>.

Installing Qtgrace on Windows

Download QtGrace from here. Extract and install.

Visualizing plots in Windows

Go to the plot file –> Right-click on it –> Open with… –> Go to the folder where you have extracted QtGrace –> Click ‘qtgrace.exe‘.

You can also open xvg files from QtGrace GUI.


Further Reading

How to run do_dssp command (mkdssp) in Gromacs 2022?

How to take snapshots of structure at specific times in GROMACS?

How to create an index file in GROMACS for MD simulation?


TAGGED:md analysisqtgracermsdrmsfxmgrace
Share This Article
Facebook Copy Link Print
ByDr. Muniba Faiza
Follow:
Dr. Muniba is a Bioinformatician based in New Delhi, India. She has completed her PhD in Bioinformatics from South China University of Technology, Guangzhou, China. She has cutting edge knowledge of bioinformatics tools, algorithms, and drug designing. When she is not reading she is found enjoying with the family. Know more about Muniba
Leave a Comment

Leave a Reply Cancel reply

You must be logged in to post a comment.

ai tools vs traditional tools in bioinformatics
AI Tools vs Traditional Tools in Bioinformatics- Which one to select?
Algorithms Artificial Intelligence Machine Learning Software Tools
AI vs Physics in Molecular Docking
AI vs Physics in Molecular Docking: Towards Faster and More Accurate Pose Prediction
Artificial Intelligence Drug Discovery Machine Learning
10 years of Bioinformatics Review: From a Blog to a Bioinformatics Knowledge Hub!
Editorial
Starting in Bioinformatics? Do This First!
Tips & Tricks

You Might Also Like

How to take snapshots of structure at specific times in GROMACS?
MD SimulationSoftwareTools

How to take snapshots of structure at specific times in GROMACS?

February 28, 2024
MD SimulationSoftwareTools

Tutorial: MD simulation output analysis of protein using GROMACS

April 6, 2023
MD simulation output analysis of a complex using GROMACS
MD SimulationProtein-ligand complex simulation

Tutorial: MD simulation output analysis of a complex using GROMACS

December 31, 2020
GROMACS: Uses & Applications
MD SimulationSoftware

GROMACS: Uses & Applications

October 10, 2021
Copyright 2024 IQL Technologies
  • Journal
  • Customer Support
  • Contact Us
  • FAQs
  • Terms of Use
  • Privacy Policy
  • Cookie Policy
  • Sitemap
Welcome Back!

Sign in to your account

Username or Email Address
Password

Lost your password?

Not a member? Sign Up