Bioinformatics ReviewBioinformatics Review
Notification Show More
Font ResizerAa
  •  Home
  • Docking
  • MD Simulation
  • Tools
  • More Topics
    • Softwares
    • Sequence Analysis
    • Algorithms
    • Bioinformatics Programming
    • Bioinformatics Research Updates
    • Drug Discovery
    • Phylogenetics
    • Structural Bioinformatics
    • Editorials
    • Tips & Tricks
    • Bioinformatics News
    • Featured
    • Genomics
    • Bioinformatics Infographics
  • Community
    • BiR-Research Group
    • Community Q&A
    • Ask a question
    • Join Telegram Channel
    • Join Facebook Group
    • Join Reddit Group
    • Subscription Options
    • Become a Patron
    • Write for us
  • About Us
    • About BiR
    • BiR Scope
    • The Team
    • Guidelines for Research Collaboration
    • Feedback
    • Contact Us
    • Recent @ BiR
  • Subscription
  • Account
    • Visit Dashboard
    • Login
Font ResizerAa
Bioinformatics ReviewBioinformatics Review
Search
Have an existing account? Sign In
Follow US
GenomicsSoftwareTools

GenomeD3 plot : Easy visualization of genomes

Dr. Muniba Faiza
Last updated: May 20, 2020 5:48 pm
Dr. Muniba Faiza
Share
3 Min Read
SHARE

As the needs say the importance of sequencing of genomes, it is equally important to visualize them. There exists some tools to visualize the genomes,but they are static and standalone, and very much complex to install and use. Newer tools are required to ease the visualization of genomes utilizing various new features and which are more interactive. GenomeD3 Plot is a newly created visualization library written in Java script. It uses the D3,i.e., Data Driven Documents Library which is used to produce dynamic, interactive data visualizations in web browsers. GenomeD3Plot is very user-friendly and allows to interact with data, dynamical view alteration is possible,and easy resize or reposition the visualization in the browser.

The goal of R Laird Matthew was to create a library with minimal external dependencies that could be integrated in to existing web applications just as a developer might include an image or table.

GenomeD3 Plot uses the JSON configuration which is a standardized and well supported data format, that reduces the complexity of use and provide better visualization. The image will be created in SVG format and can be easily imported to PNG format as per the requirements.

Fig.1

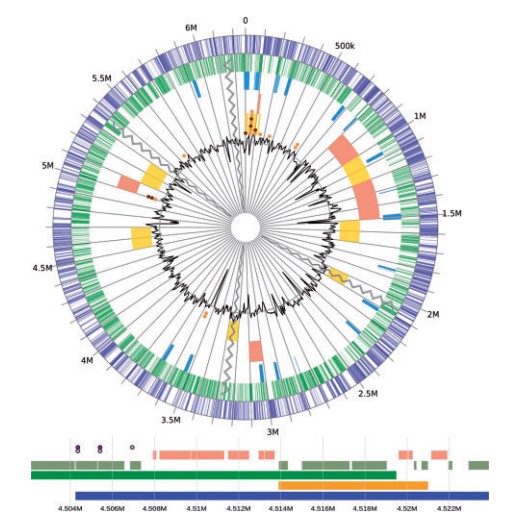
Fig.1  GenomeD3Plot circular and linear visualization of an example genome
with annotation data

With GenomeD3 Plot, the genome can be viewed in differnt tracks, such as if one wish to view a specific base pair or a series of base pairs to visualize GC content, or more.GenomeD3 Plot provides a rich API ( application program interface that specifies how software components should interact) to dynamically manipulate visualization.

A linear and circular plot can also be tied together so that manipulation of one will cause a mirror alteration in the other, such as zooming or changing the visible region of the genome. A specific region can be recentre to focus. Many other features have been introduced in GenomeD3 Plot for easy visualization and interpretation of genomes.

Note:

An exhaustive list of references for this article is available with the author and is available on personal request, for more details write to muniba@bioinformaticsreview.com.

Share This Article
Facebook Copy Link Print
ByDr. Muniba Faiza
Follow:
Dr. Muniba is a Bioinformatician based in New Delhi, India. She has completed her PhD in Bioinformatics from South China University of Technology, Guangzhou, China. She has cutting edge knowledge of bioinformatics tools, algorithms, and drug designing. When she is not reading she is found enjoying with the family. Know more about Muniba
Leave a Comment

Leave a Reply Cancel reply

You must be logged in to post a comment.

Starting in Bioinformatics? Do This First!
Tips & Tricks
[Editorial] Is it ethical to change the order of authors’ names in a manuscript?
Editorial Opinion
Installing bbtools on Ubuntu
[Tutorial] Installing BBTools on Ubuntu (Linux).
Sequence Analysis Software Tools
wes_data_analysis Whole Exome Sequencing (WES) Data visualization Toolkit
wes_data_analysis: Whole Exome Sequencing (WES) Data visualization Toolkit
Bioinformatics Programming GitHub Python

You Might Also Like

Build molecules in Pymol
Tools

How to build molecules in Pymol?

January 8, 2021
Molecular dynamicsSoftwareTools

Tutorial: Molecular dynamics (MD) simulation using Gromacs

April 10, 2023
GenomicsSoftwareTools

Methods to detect the effects of alternative splicing and transcription on proteins

May 20, 2020
mega7
PhylogeneticsSoftwareTools

Tutorial: Constructing phylogenetic tree using MEGA7

September 30, 2020
Copyright 2024 IQL Technologies
  • Journal
  • Customer Support
  • Contact Us
  • FAQs
  • Terms of Use
  • Privacy Policy
  • Cookie Policy
  • Sitemap
Welcome Back!

Sign in to your account

Username or Email Address
Password

Lost your password?

Not a member? Sign Up