Molecular dynamics (MD) simulation is an important step in studying the dynamics of macromolecules. In one of the previous articles, MD simulation of chain A of insulin (PDB ID: 1ZNI) was performed using GROMACS. The output analysis of that simulation is explained in this article.
The last MD simulation of insulin protein was performed at 1 ns. The same output files will be used to analyze the results.
The trjconv module will be used for trajectory analysis. But before starting the analysis, we need to correct the trajectory because it might be possible that the protein may appear broken or located on any side of the box other than being in the center. To do this, we need .tpr and .xtc files as input that we obtained from the final MD run. Open the terminal, and type the following command:
$ gmx trjconv -s md_0_1.tpr -f md_0_1.xtc -o md_0_1_noPBC.xtc -pbc mol -center
When prompted, type “1” for selecting “Protein” as the group to be centered and “0” for “System”. It will generate md_0_1_noPBC.xtc as output that will be used for the analysis as shown below.
1. RMSD
Root mean square deviation (RMSD) calculates the deviation between the two structures. gmx rms module is used to calculate the RMSD of the simulated protein.
$ gmx rms -s md_0_1.tpr -f md_0_1_noPBC.xtc -o rmsd.xvg -tu ns
here, -tu refers to time units.
When prompted, type “4” for selecting “Backbone” and “0” for “System”. It will generate rmsd.xvg file that can be plotted using xmgrace software. The RMSD plot for this simulation looks like this:
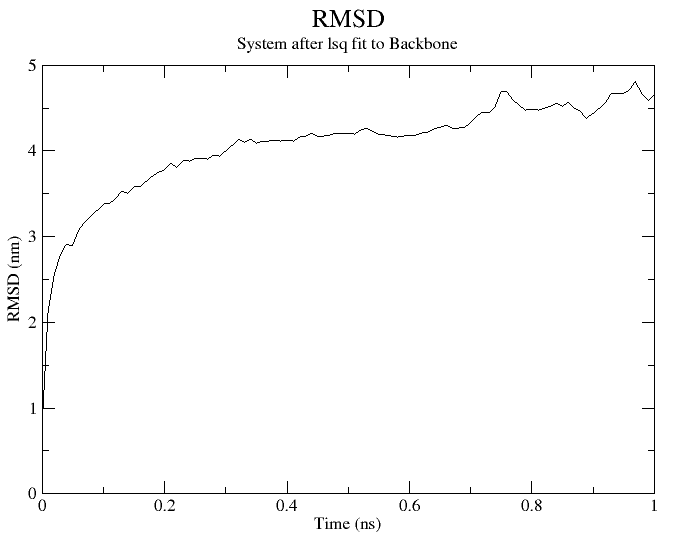
Fig. 1 RMSD plot of insulin simulated at 1ns.
RMSD relative to the crystal structure present in the minimized equilibrated system can also be calculated using the following command:
$ gmx rms -s em.tpr -f md_0_1_noPBC.xtc -o rmsd_cyrstal.xvg -tu ns
The plot is shown in Fig. 2.

Fig. 2 RMSD plot relative to the minimized and equilibrated crystal structure of insulin.
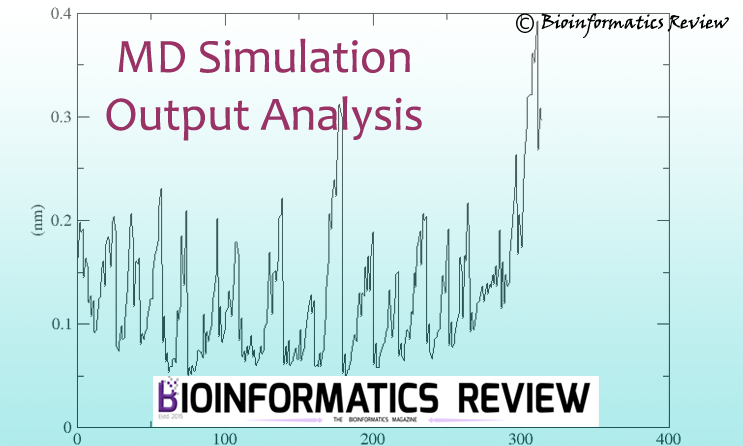
2. RMSF
Root Mean Square Fluctuation (RMSF) calculates the fluctuation of atoms at positions in the trajectory. gmx rmsf module will be used to calculate the RMSF of the simulated protein.
$ gmx rmsf -f md_0_1_noPBC.xtc -s md_0_1.tpr -o rmsf.xvg
When prompted, type “1” for “Protein”. The generated plot is shown in Fig. 3.
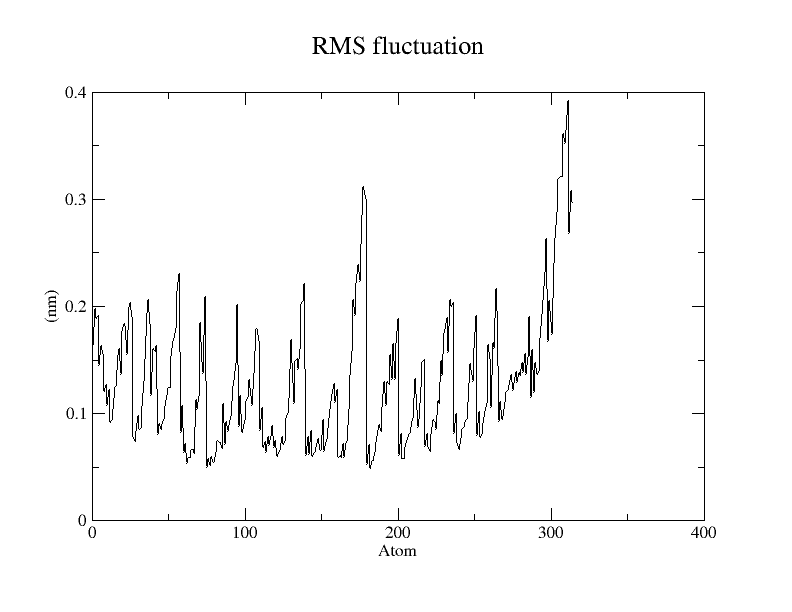
Fig. 3 RMSF plot of simulated insulin protein.
If you want to see RMSF wrt residues then use the following command:
$ gmx rmsf -f md_0_1_noPBC.xtc -s md_0_1.tpr -o rmsf.xvg -res
3. Radius of gyration
The radius of gyration calculates the radii of gyration of a molecule about the three axes (x, y, and z) as a function of time. gmx gyrate module is used for this.
$ gmx gyrate -f md_0_1_noPBC.xtc -s md_0_1.tpr -o gyrate.xvg
When prompted, type “1” for protein. The generated plot is shown in Fig. 4.
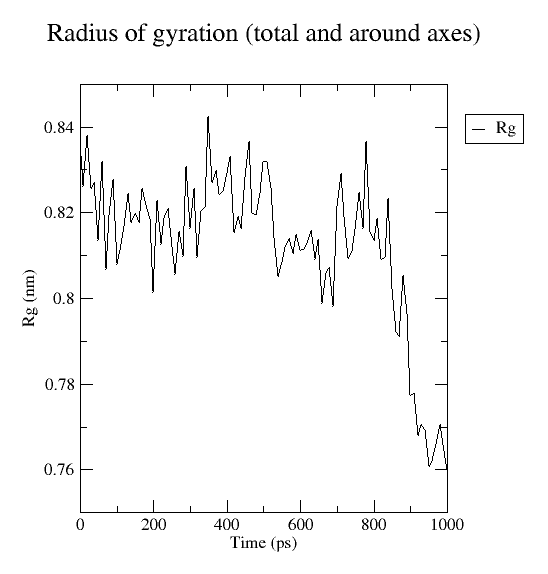
Fig. 4 Radius of gyration plotted for insulin simulated at 1ns.
4. Hydrogen bonds
gmx hbond module is used to analyze hydrogen bonds that are calculated on the basis of cutoffs for the angle Hydrogen – Donor-Acceptor and the distance Donor-Acceptor (or Hydrogen – Acceptor). Generally, quite useful in complex analysis.
$ gmx hbond -f md_0_1_noPBC.xtc -s md_0_1.tpr -num -dist
here, -num calculates the number of hydrogen bonds and -dist calculates the average distance among them.
When prompted, type “1” for “Protein” and select the other group that does not overlap with the protein, for example, here in this simulation, we have selected “11” for “Non-protein”. If you are performing a complex simulation, then you can select Protein and Ligand. This will display the status of hydrogen bonds between the protein and the ligand. In that case, it is helpful in analyzing the stability of hydrogen bonds between the receptor and ligand. The generated plots are shown in Fig. 5 & 6.
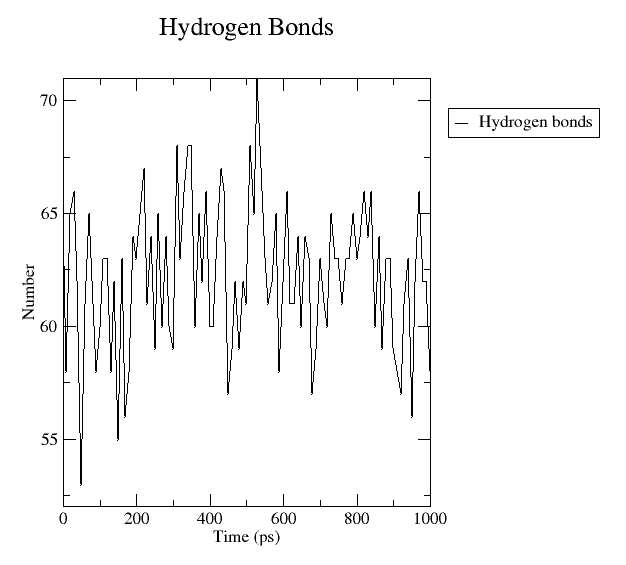
Fig. 5 Number of hydrogen bonds calculated between the protein and non-protein.

Fig. 6 Distribution of hydrogen bonds calculated between the protein and non-protein.
These are the basic modules that are used to analyze MD simulations. You can always use additional arguments in these modules and the other modules as well.
MD simulation of a receptor-ligand complex will be explained in the upcoming articles.