Bioinformatics ReviewBioinformatics Review
Notification Show More
Font ResizerAa
  •  Home
  • Docking
  • MD Simulation
  • Tools
  • More Topics
    • Softwares
    • Sequence Analysis
    • Algorithms
    • Bioinformatics Programming
    • Bioinformatics Research Updates
    • Drug Discovery
    • Phylogenetics
    • Structural Bioinformatics
    • Editorials
    • Tips & Tricks
    • Bioinformatics News
    • Featured
    • Genomics
    • Bioinformatics Infographics
  • Community
    • BiR-Research Group
    • Community Q&A
    • Ask a question
    • Join Telegram Channel
    • Join Facebook Group
    • Join Reddit Group
    • Subscription Options
    • Become a Patron
    • Write for us
  • About Us
    • About BiR
    • BiR Scope
    • The Team
    • Guidelines for Research Collaboration
    • Feedback
    • Contact Us
    • Recent @ BiR
  • Subscription
  • Account
    • Visit Dashboard
    • Login
Font ResizerAa
Bioinformatics ReviewBioinformatics Review
Search
Have an existing account? Sign In
Follow US
SoftwareTranscriptomics

GIANT: A New Tool for Transcriptomic Data Analysis

Tariq Abdullah
Last updated: November 18, 2020 3:33 pm
Tariq Abdullah
Share
2 Min Read
Transcriptomic data analysis
SHARE

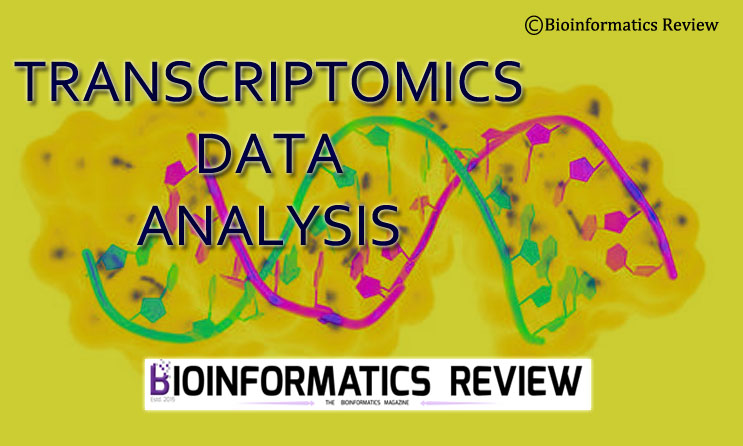
Transcriptomic data analysis is an important requirement in biomedical research. The bioinformatics tools available for transcriptomic data analysis provide a user-friendly interface that is easily accessible by the experimental biologists as well. A new tool called GIANT-Galaxy-based tool for Interactive ANalysis of Transcriptomic data has been developed by Vandel et al., [1].

Contents
How GIANT works?References

GIANT is a set of tools allowing researchers to analyze transcriptomic data from microarray or RNA-seq analyses [1]. It consists of different modules facilitating the easy selection of tools for a particular analysis. The source code of the GIANT is freely downloadable on Github (https://github.com/juliechevalier/GIANT). The Galaxy tool suite is available on the Galaxy Main Tool Shed (https://toolshed.g2.bx.psu.edu; name:suite_giant; owner:vandelj).

How GIANT works?

GIANT takes raw data from microarray or RNA-seq. Depending upon that, it selects methodology to process the data.

  • Firstly, it subjects the input data to a quality check.
  • In the next step, it leads to normalization including differential analysis in both the cases (microarray and RNA-seq).
  • After differential analysis, the data is subjected to another quality check. It is highly recommended [1].
  • After that, it generates volcano plots and heatmaps, performs clustering and GSEA formatting as per the user requirements.

GIANT suite consists of various adjustable parameters to improve the analysis and visualization of transcriptomic data. As an output, it provides interactive plots, tabular results, and easy visualization and sharing of the data. For further reading, click here.


References

  1. Vandel, J., Gheeraert, C., Staels, B., Eeckhoute, J., Lefebvre, P., & Dubois-Chevalier, J. (2020). GIANT: Galaxy-based tool for Interactive ANalysis of Transcriptomic data. Scientific Reports.
TAGGED:Bioinformaticsdata analysisdata visualizationmicroarray datarna-seq datatranscriptomics
Share This Article
Facebook Copy Link Print
ByTariq Abdullah
Tariq is founder of Bioinformatics Review and Lead Developer at IQL Technologies. His areas of expertise include algorithm design, phylogenetics, MicroArray, Plant Systematics, and genome data analysis. If you have questions, reach out to him via his homepage.
Leave a Comment

Leave a Reply Cancel reply

You must be logged in to post a comment.

Starting in Bioinformatics? Do This First!
Tips & Tricks
[Editorial] Is it ethical to change the order of authors’ names in a manuscript?
Editorial Opinion
Installing bbtools on Ubuntu
[Tutorial] Installing BBTools on Ubuntu (Linux).
Sequence Analysis Software Tools
wes_data_analysis Whole Exome Sequencing (WES) Data visualization Toolkit
wes_data_analysis: Whole Exome Sequencing (WES) Data visualization Toolkit
Bioinformatics Programming GitHub Python

You Might Also Like

Where to find Docking and simulation software?
SoftwareTools

Where to find Docking and MD simulation software?

June 4, 2021
How to generate topology from SMILES for MD Simulation?
SoftwareTools

How to generate topology from SMILES for MD Simulation?

August 6, 2023
[Tutorial] Performing docking using DockingPie plugin in PyMOL.
DockingSoftwareTools

[Tutorial] Performing docking using DockingPie plugin in PyMOL.

January 10, 2024
GenomicsSoftwareTools

GenomeD3 plot : Easy visualization of genomes

May 20, 2020
Copyright 2024 IQL Technologies
  • Journal
  • Customer Support
  • Contact Us
  • FAQs
  • Terms of Use
  • Privacy Policy
  • Cookie Policy
  • Sitemap
Welcome Back!

Sign in to your account

Username or Email Address
Password

Lost your password?

Not a member? Sign Up