Bioinformatics ReviewBioinformatics Review
Notification Show More
Font ResizerAa
  •  Home
  • Docking
  • MD Simulation
  • Tools
  • More Topics
    • Softwares
    • Sequence Analysis
    • Algorithms
    • Bioinformatics Programming
    • Bioinformatics Research Updates
    • Drug Discovery
    • Phylogenetics
    • Structural Bioinformatics
    • Editorials
    • Tips & Tricks
    • Bioinformatics News
    • Featured
    • Genomics
    • Bioinformatics Infographics
  • Community
    • BiR-Research Group
    • Community Q&A
    • Ask a question
    • Join Telegram Channel
    • Join Facebook Group
    • Join Reddit Group
    • Subscription Options
    • Become a Patron
    • Write for us
  • About Us
    • About BiR
    • BiR Scope
    • The Team
    • Guidelines for Research Collaboration
    • Feedback
    • Contact Us
    • Recent @ BiR
  • Subscription
  • Account
    • Visit Dashboard
    • Login
Font ResizerAa
Bioinformatics ReviewBioinformatics Review
Search
Have an existing account? Sign In
Follow US
DockingSoftwareTools

Most widely used software for docking results image generation

Tariq Abdullah
Last updated: December 19, 2020 6:32 pm
Tariq Abdullah
Share
3 Min Read
docking result visualization tools
SHARE

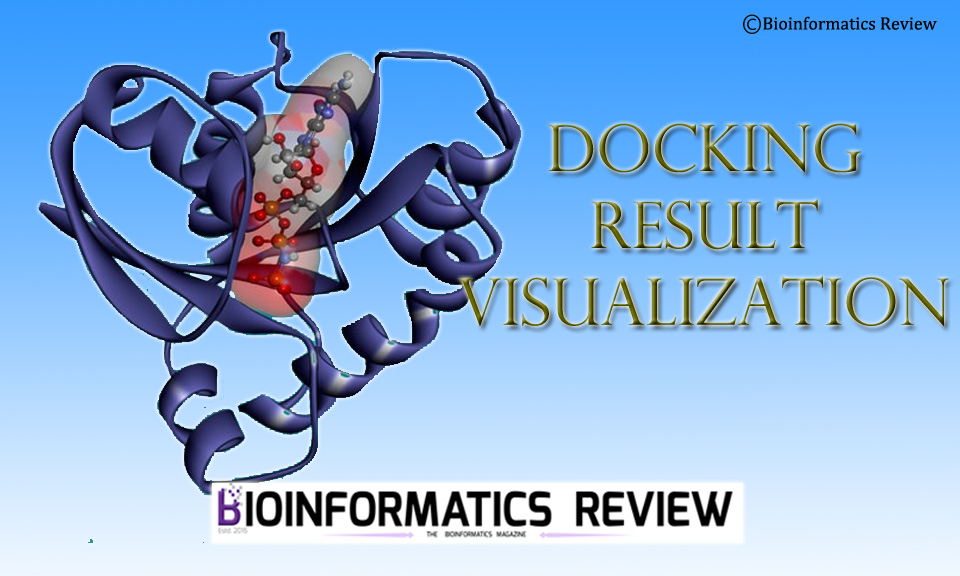
Computational docking is an important technique in bioinformatics. The docking result interpretation and representation are important as well. There are various software available for docking result analysis and offer to generate high-quality images for publications. In this article, we will mention such a few software for the same purpose.

Contents
1. Pymol2. Discovery Studio (DS) Visualizer3. Autodock Tools4. VMDFurther ReadingReferences

1. Pymol

Pymol [1] is a user-friendly bioinformatics tool for macromolecules visualization. It can easily generate high-quality images at different resolutions (90, 150, and 300 dpi). The higher the dpi value, the better the image. Additionally, users can set the height and width of the image keeping the background transparent or non-transparent. You can set the background as white, black, grey, and light grey according to your display needs. You can even set the display to the publication type. Also, you can save the whole session to resume later.

2. Discovery Studio (DS) Visualizer

DS Visualizer [2] is another good software for docking analysis as well as image generation for publications. Users can easily visualize interactions between the receptor and the ligand. Additionally, label color and font can be easily set along with background color and receptor color. You can set to visualize the receptor surface including aromatic, H-bond, charge, ionizability, or solvent accessible surface (SAS). You can easily generate a 2D diagram of interactions and save it in PNG format. Further, you can save the whole session to resume later.

3. Autodock Tools

Besides docking file preparation and docking, you can use autodock tools [3] for macromolecular visualization and image generation. It can also open the Vina docking output file and you can easily analyze it. Similar to other tools, the background color can be easily set. You can represent the receptor and ligand as lines, sticks, spheres, or surface. Additionally, it supports rendering large images in TIFF format. You can also save the session for later use.

4. VMD

VMD [4] is another useful bioinformatics tool for macromolecular visualization. You can set different display styles of receptors using VMD. Also, you can set the background color as solid or gradient which gives it a nice look. Additionally, you can render the receptor in different formats such as postscript, snapshot, NVIDIA Gelato, and so on.


Further Reading

  • Tutorial: Vina Output Analysis Using PyMol
  • Video Tutorial: Autodock Vina Result Analysis with PyMol
  • Vina output analysis using Discovery Studio visualizer

References

  1. DeLano, W. L. (2002). PyMOL.
  2. Visualizer, D. S. (2005). Accelrys software inc. Discovery Studio Visualizer, 2.
  3. Morris, G. M., Huey, R., & Olson, A. J. (2008). Using autodock for ligand‐receptor docking. Current protocols in bioinformatics, 24(1), 8-14.
  4. Humphrey, W., Dalke, A., & Schulten, K. (1996). VMD: visual molecular dynamics. Journal of molecular graphics, 14(1), 33-38.
TAGGED:dockingdocking result analysisDS visualizerPymol
Share This Article
Facebook Copy Link Print
ByTariq Abdullah
Tariq is founder of Bioinformatics Review and Lead Developer at IQL Technologies. His areas of expertise include algorithm design, phylogenetics, MicroArray, Plant Systematics, and genome data analysis. If you have questions, reach out to him via his homepage.
Leave a Comment

Leave a Reply Cancel reply

You must be logged in to post a comment.

- Advertisement -
Ad image
10 years of Bioinformatics Review: From a Blog to a Bioinformatics Knowledge Hub!
Editorial
Starting in Bioinformatics? Do This First!
Tips & Tricks
[Editorial] Is it ethical to change the order of authors’ names in a manuscript?
Editorial Opinion
Installing bbtools on Ubuntu
[Tutorial] Installing BBTools on Ubuntu (Linux).
Sequence Analysis Software Tools

You Might Also Like

GenomicsSoftware

What is PRSice?

May 20, 2020
How to use vs_analysis python script for virtual screening result analysis of Autodock Vina
DockingVideo TutorialVirtual Screening

Video Tutorial: How to use vs_analysis Python script for virtual screening result analysis of Autodock Vina?

November 23, 2024
Cloud ComputingTools

Cl-Dash: speeding up cloud computing in bioinformatics

January 24, 2016
SoftwareTools

Cytoscape.js : A graph library for network visualization and analysis

May 20, 2020
Copyright 2024 IQL Technologies
  • Journal
  • Customer Support
  • Contact Us
  • FAQs
  • Terms of Use
  • Privacy Policy
  • Cookie Policy
  • Sitemap
Welcome Back!

Sign in to your account

Username or Email Address
Password

Lost your password?

Not a member? Sign Up