This is a continuation article of our previous post: Tutorial-I: Functional Divergence Analysis using DIVERGE 3.0 software. In our last tutorial, we explained Type-II functional divergence. In this article, we will explain the rest of the evolutionary analysis using DIVERGE 3.0 software [1].
6. Functional Distance Analysis
Functional Distance Analysis shows the distance among the clusters as shown in Figure 4 (continuing from our last tutorial). You don’t have to click any button, it appears on the screen after you switch to the ‘Functional Distance Analysis’ tab on the DIVERGE window.
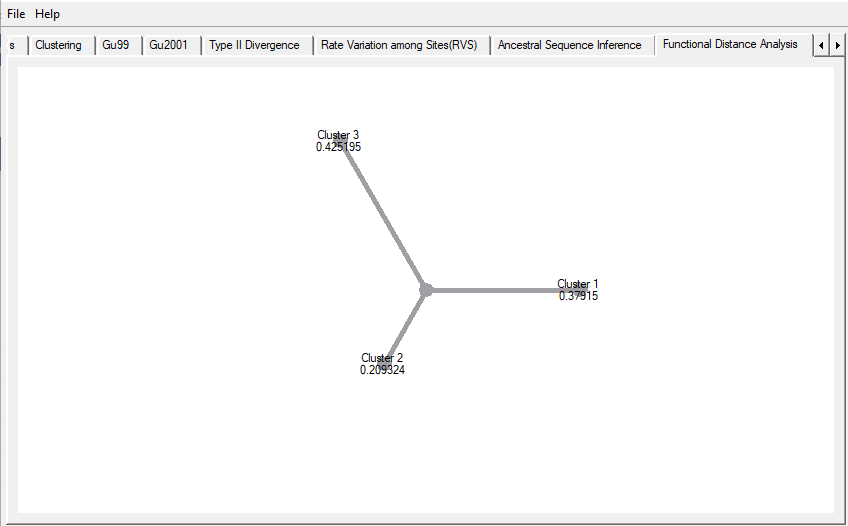
Figure 4. Functional Distance among the selected clusters.
7. Type-I Analysis
Type-I Analysis provides site-specific profiles and amino acid residues involved in functional divergence [2]. It performs this test for the five non-degenerate patterns: S0 to S4.
S0 means no Type-I divergence in any cluster,
S1 signifies Type-I divergence in cluster 1, and so on,
Finally, S4 means all the clusters have experienced Type-I divergence.
- To perform this analysis, click on the ‘Type-I Analysis’ tab on the window and click ‘Calculate‘ (Figure 5).
- You can see the sites at which Type-I divergence is identified.
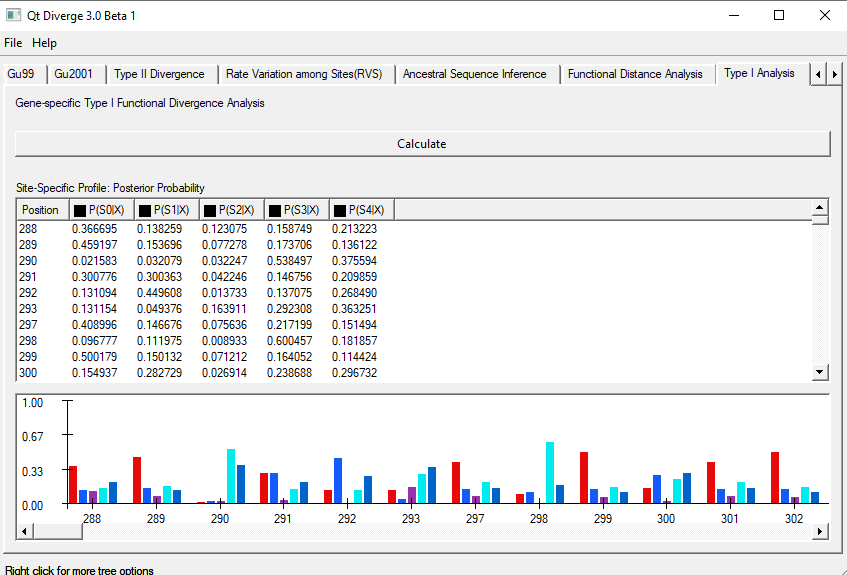
Figure 5. Type-I Analysis using DIVERGE 3.0.
8. Asymmetric Test for Type-I
DIVERGE 3.0 software calculates Type-I functional divergence coefficient (ӨI). It identifies the sites having different
evolutionary rates caused by the functional divergence [3].
- To perform this test, go to the ‘Asymmetric Test for Type-I’ tab on the window and click ‘Calculate‘ (Figure 6).
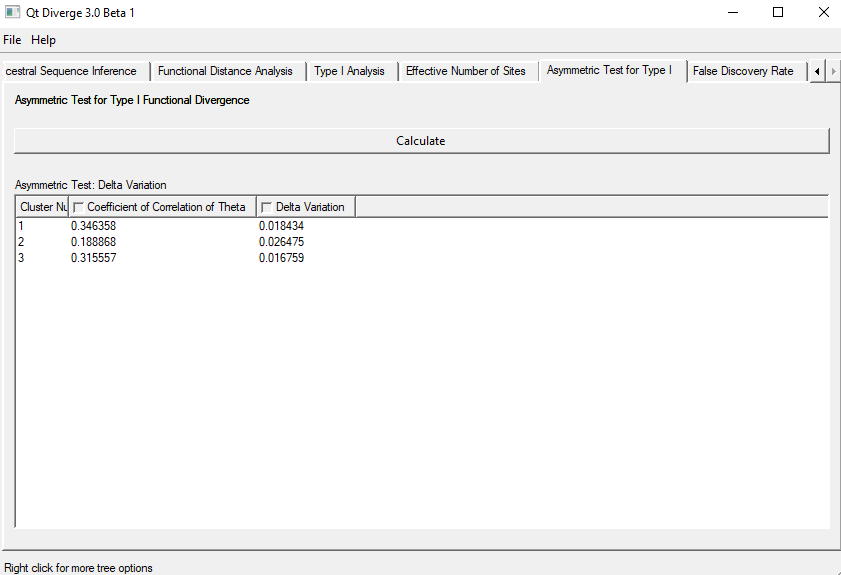
Figure 6. Asymmetric Test for Type-I Functional Divergence.
This finishes the Functional Divergence analysis of clusters. Now, let’s focus on some steps that require changes in clustering.
9. Rate Variation Among Sites (RVS)
This test displays the number of sites that have changed over a period of time.
- In order to perform this test, you need to create only one cluster.
- For that, go back to the ‘Clustering‘ tab and delete other two clusters or delete all and create a new one.
- After that, come back to the RVS tab and click ‘Calculate‘.
The analysis is shown in Figure 7. As you can see, Cluster3 Xk refers to the number of changes and Cluster3 Rk refers to the Posterior mean of the evolutionary rate.
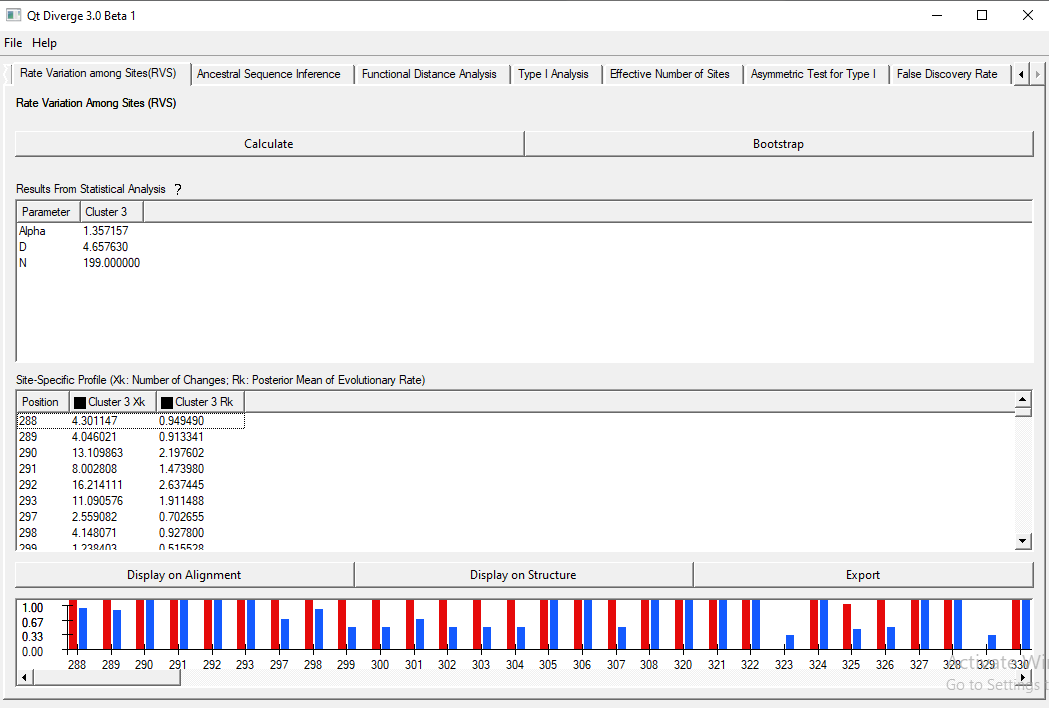
Figure 7. Rate Variation Among Sites analysis results.
10. Effective Number of Sites
This test gives the most effective sites in the clusters according to Type-I and Type-II Functional Divergence.
- You need to create two clusters for this test. So, follow the steps mentioned in previous test to make chnages in clustering.
- The results are shown in Figure 8.
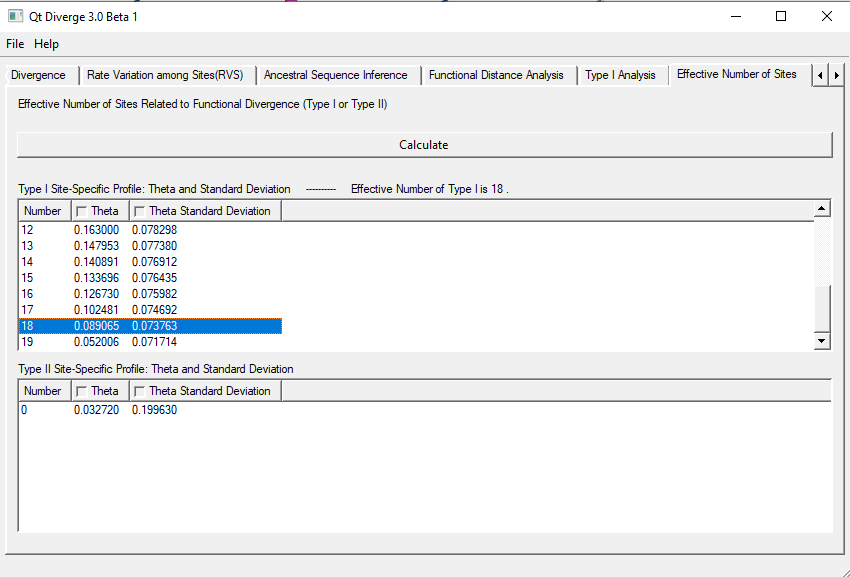
Figure 8. Effective Number of Sites.
This finishes our second part of tutorial on Functional Divergence Analysis using DIVERGE 3.0 software.
References
- Gu, X., Zou, Y., Su, Z., Huang, W., Zhou, Z., Arendsee, Z., & Zeng, Y. (2013). An update of DIVERGE software for functional divergence analysis of protein family. Molecular biology and evolution, 30(7), 1713-1719.
- Gu, X. (2001). A site-specific measure for rate difference after gene duplication or speciation. Molecular biology and evolution, 18(12), 2327-2330.
- Gu, X., & Vander Velden, K. (2002). DIVERGE: phylogeny-based analysis for functional–structural divergence of a protein family. Bioinformatics, 18(3), 500-501.