Bioinformatics ReviewBioinformatics Review
Notification Show More
Font ResizerAa
  •  Home
  • Docking
  • MD Simulation
  • Tools
  • More Topics
    • Softwares
    • Sequence Analysis
    • Algorithms
    • Bioinformatics Programming
    • Bioinformatics Research Updates
    • Drug Discovery
    • Phylogenetics
    • Structural Bioinformatics
    • Editorials
    • Tips & Tricks
    • Bioinformatics News
    • Featured
    • Genomics
    • Bioinformatics Infographics
  • Community
    • BiR-Research Group
    • Community Q&A
    • Ask a question
    • Join Telegram Channel
    • Join Facebook Group
    • Join Reddit Group
    • Subscription Options
    • Become a Patron
    • Write for us
  • About Us
    • About BiR
    • BiR Scope
    • The Team
    • Guidelines for Research Collaboration
    • Feedback
    • Contact Us
    • Recent @ BiR
  • Subscription
  • Account
    • Visit Dashboard
    • Login
Font ResizerAa
Bioinformatics ReviewBioinformatics Review
Search
Have an existing account? Sign In
Follow US
Protein VisualizationSoftwareTools

Plugin to visualize CASTp results in PyMOL

Tariq Abdullah
Last updated: July 24, 2020 2:18 pm
Tariq Abdullah
Share
1 Min Read
CASTpyMOL plugin for pymol
SHARE

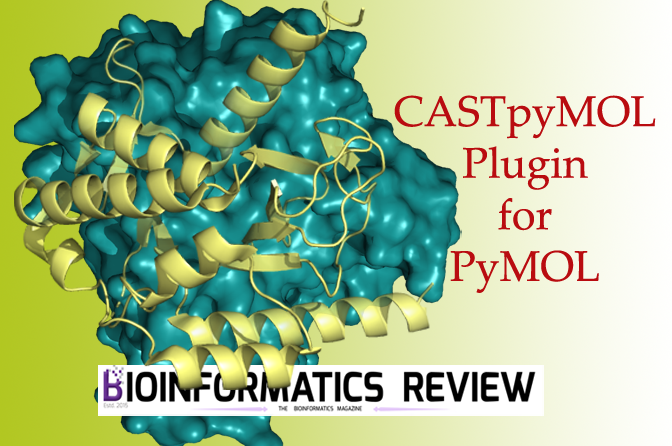
CASTp (Computed Atlas of Surface Topography of proteins) server is used to predict binding pockets and cavities in proteins [1]. It displays binding pockets precisely and predicts all possible binding pockets or cavities based on an algorithm.

The pockets can be viewed in different colors and styles. CASTp server allows users to download their results. However, it is more convenient to visualize these results. For that purpose, there is a plugin called CASTpyMOL v3.0 that can be installed easily and all the results generated by the CASTp server can be visualized in PyMOL.

Installing Plugin

  1. Download the plugin from here.
  2. Open PyMOL.
  3. Go to ‘Plugin’ –> ‘Plugin Manager’.
  4. Click ‘Install New Plugin’ –> ‘Choose File’. Select the downloaded plugin file.
  5. Restart PyMOL.

Now you can open CASTp result files in PyMOL to visualize all predicted binding pockets. Additionally, you can view through its PDB or job id from the CASTp server.


References

  1. Tian, W., Chen, C., Lei, X., Zhao, J., & Liang, J. (2018). CASTp 3.0: computed atlas of surface topography of proteins. Nucleic acids research, 46(W1), W363-W367.
TAGGED:castp serverpluginPymol
Share This Article
Facebook Copy Link Print
ByTariq Abdullah
Tariq is founder of Bioinformatics Review and Lead Developer at IQL Technologies. His areas of expertise include algorithm design, phylogenetics, MicroArray, Plant Systematics, and genome data analysis. If you have questions, reach out to him via his homepage.
Leave a Comment

Leave a Reply Cancel reply

You must be logged in to post a comment.

Starting in Bioinformatics? Do This First!
Tips & Tricks
[Editorial] Is it ethical to change the order of authors’ names in a manuscript?
Editorial Opinion
Installing bbtools on Ubuntu
[Tutorial] Installing BBTools on Ubuntu (Linux).
Sequence Analysis Software Tools
wes_data_analysis Whole Exome Sequencing (WES) Data visualization Toolkit
wes_data_analysis: Whole Exome Sequencing (WES) Data visualization Toolkit
Bioinformatics Programming GitHub Python

You Might Also Like

How to calculate binding pocket volume using PyVol plugin in PyMol?
SoftwareTools

How to calculate binding pocket volume using PyVol plugin in PyMol?

November 20, 2022
Sequence AnalysisSoftware

IBS: Modifying the organization of biological sequences diagramatically

December 11, 2015
LipidomicsSoftwareTools

Lipidomics: An overview

May 20, 2020
[Tutorial] Installing HTSlib on Ubuntu (Linux).
SoftwareTools

[Tutorial] Installing HTSlib on Ubuntu (Linux).

March 13, 2025
Copyright 2024 IQL Technologies
  • Journal
  • Customer Support
  • Contact Us
  • FAQs
  • Terms of Use
  • Privacy Policy
  • Cookie Policy
  • Sitemap
Welcome Back!

Sign in to your account

Username or Email Address
Password

Lost your password?

Not a member? Sign Up